SOURCE DOCUMENT • WORKING DRAFT
The complete evaluation
All content from the supplied report, including the embedded quotes and partner diagrams. Original charts and maps appear in their report order.
The supplied evaluation is marked DRAFT, has an unfinished date and an acknowledgements question, and references Appendices A, B, and C that are not included in the file. Those draft elements are retained below. Formatting and punctuation have been adapted for the web. The original Word document is available above.
Milwaukee County Safe Summer Sites (SSS) Evaluation
DRAFT
XXXX, 2026
This evaluation report was developed by Constance Kostelac and Charles Vear of the Medical College of Wisconsin, Institute for Health and Humanity and Comprehensive Injury Center with input and feedback from numerous partners and stakeholders.
Acknowledgements
Question for the group: We have the various organizations that are part of this initiative listed within the report. Do we want a specific list of agencies/organizations for acknowledgement or is the specific reference within the document sufficient?
What is the issue?
Any injury or loss of life due to violence is too many. When violence involves a young person, the pain impacts those directly involved, as well as family and friends, and can have ripple effects across an entire community. Heading into summer 2026, Milwaukee was seeing substantial reductions in serious violent crime. By early June, homicides and nonfatal shootings were down more than 25% overall and over 20% for involving youth and young adults, representing fewer individuals and families directly impacted than the previous year. This was an indication of progress related to multiple efforts across Milwaukee County connected to the community violence intervention ecosystem that includes the city, the county, community based organizations, and partners across violence prevention, healthcare, schools, the criminal legal system, business and faith based organizations, and residents working together toward a shared goal of reducing violence and the impact on individuals, families, and the community.
At the same time, there was an understanding that summer tends to have higher levels of violence and that there is a need to continue this progress by investing upstream in the prevention of violence. The focus was on the connection between violence prevention and addressing mental health, providing opportunities for youth, building trusted relationships, and focusing on healing. The Safe Summer Sites (SSS) initiative was established as an investment in activities and spaces that can support the prevention of violence before it happens and creating an environment where young people can be safe, supported, connected, and reminded that the community is investing in them and in their future.
Key Takeaways
The following represents some of the key takeaways from the initiative:
Investment and workforce: About $1.14 million in direct funding and roughly $2 million in MPS shared resources supported all of the activities and locations for the SSS. This also included 184 people employed, 64 paid youth ambassadors, and 24 safe passage team members, alongside a broad base of community partners.
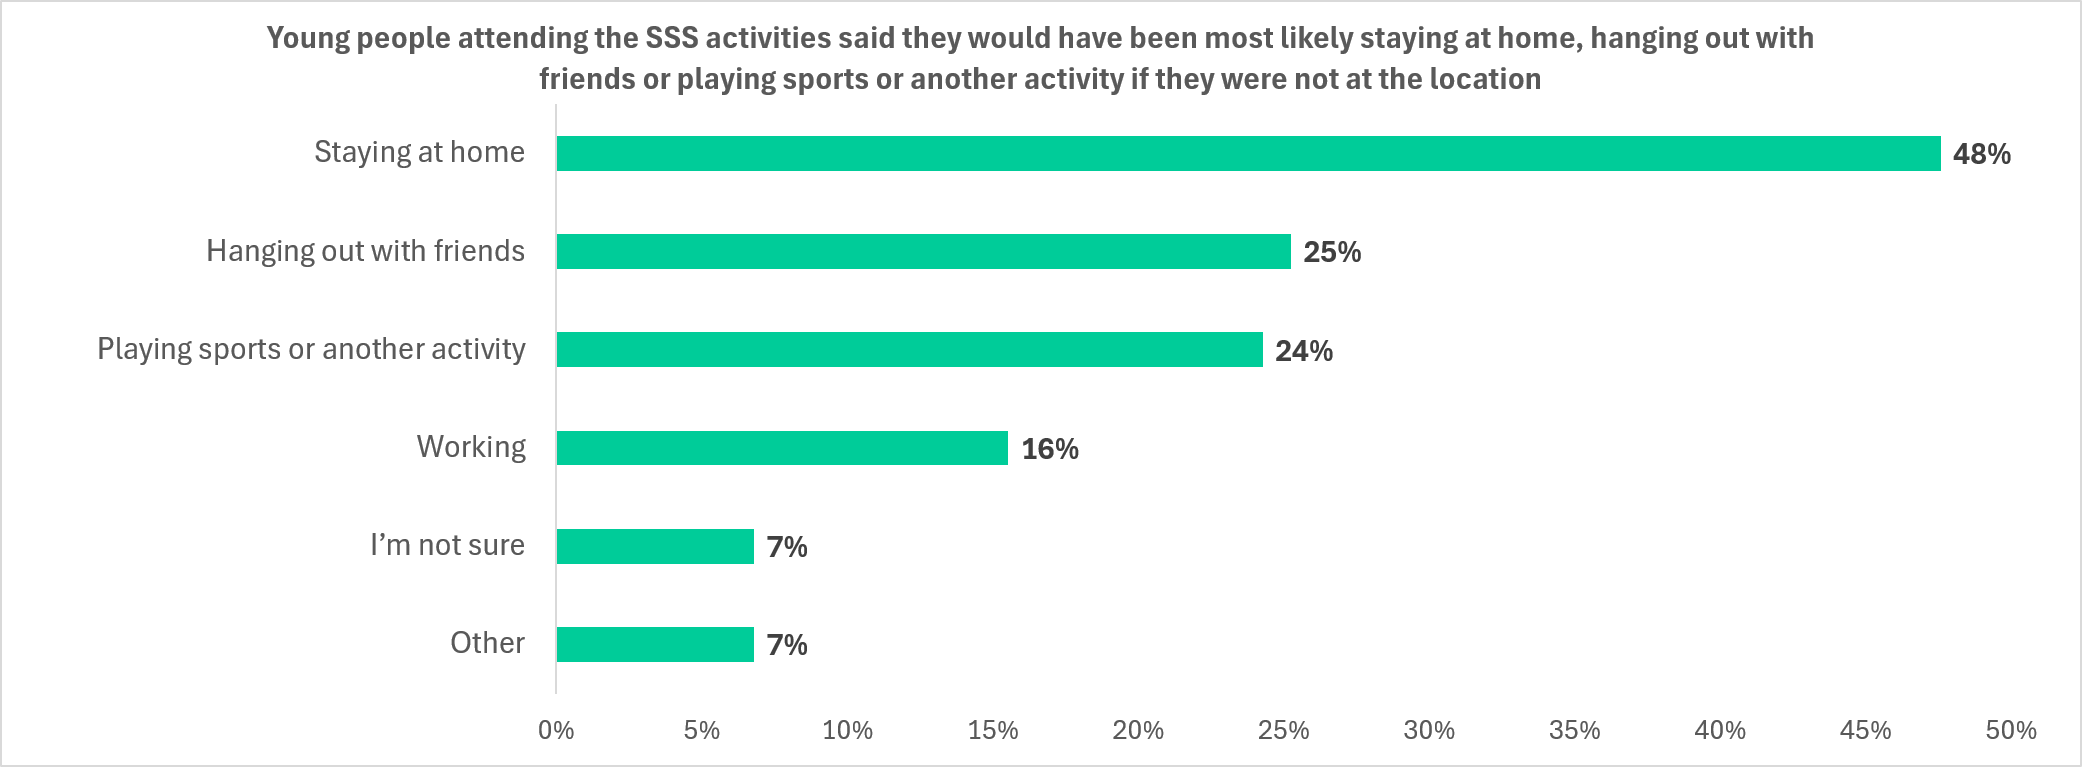
Where and When: SSS operated at 12 anchor locations from June 22 to August 30, 2026, with 4,870 recorded visits at MPS sites (at least 1,300 unique youth) and about 1,766 unique attendees at community sites with primary hours during the time when risk of involvement in violence is high (5:30 to 9:00/9:30 pm) and young people have fewer alternatives available for safe and engaging spaces. Without SSS, youth said they would most likely have been at home, with friends, or playing sports.
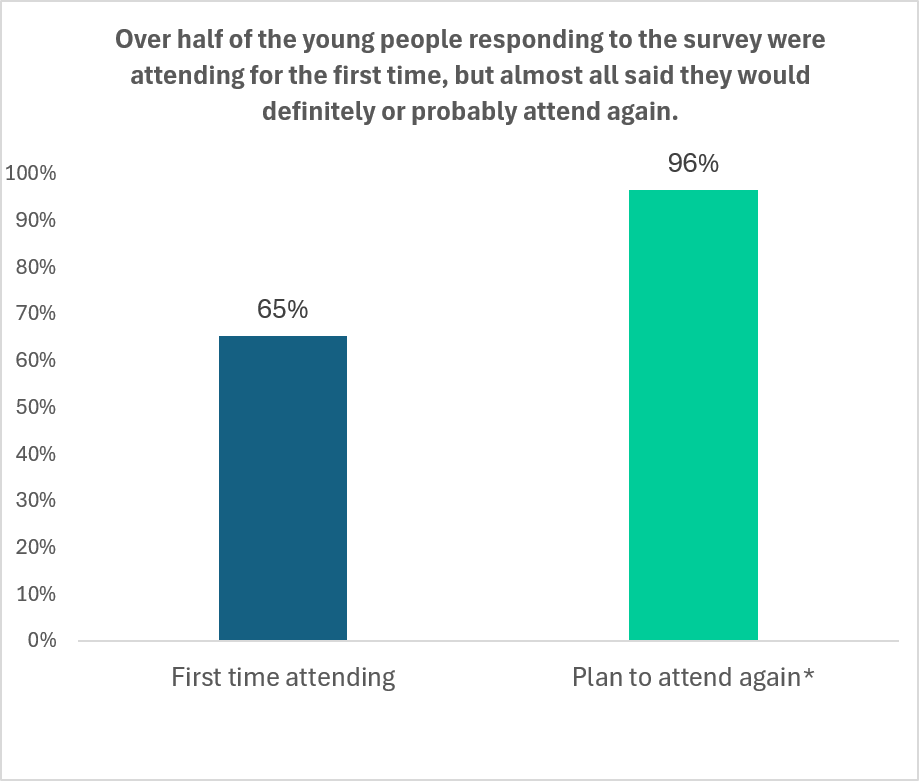
Who attended: Survey respondents were mostly ages 12 to 17 (87%), and 65% were attending for the first time. Attendees came from parts of Milwaukee that experience high levels of violence with 53208, 53218, 53209, 53216, and 53206 the most common ZIP codes.
Outreach: Digital outreach generated more than 7.6 million impressions and with a reach of over 2.7 million people (with potential duplicates across different sites and formats), with much of this audience being adults. Parents or guardians (37%) were the most common way young people learned about SSS, so outreach to caregivers matters as much as outreach to youth.
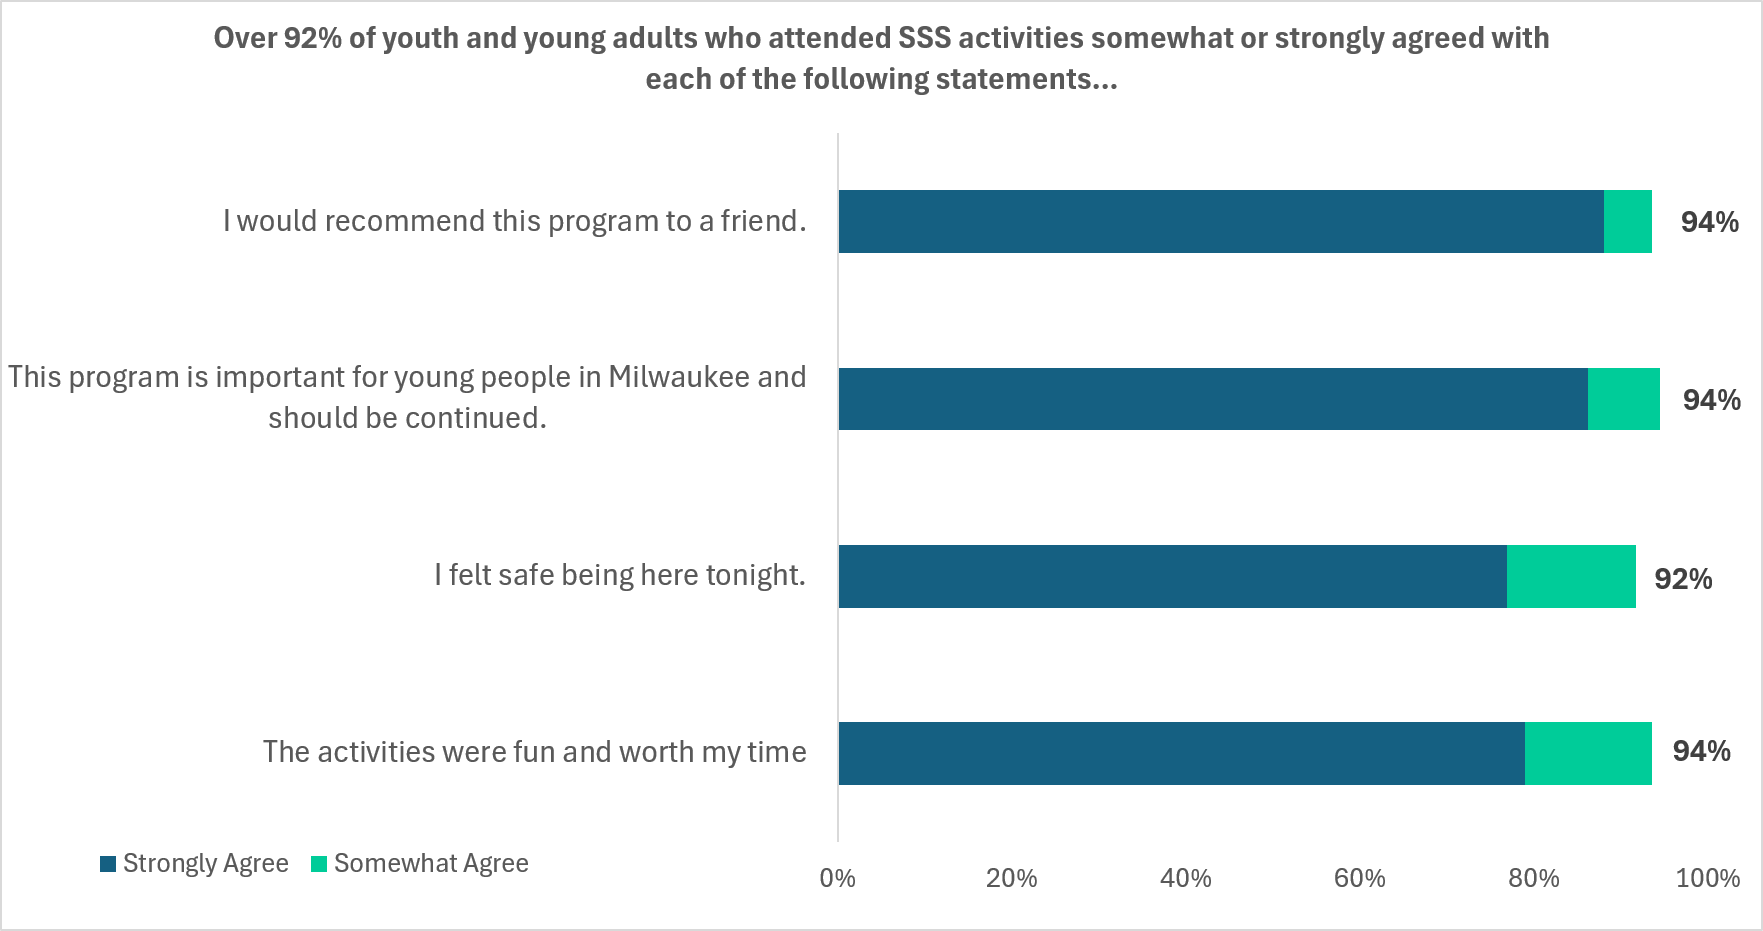
Youth and young adult experience: Over 92% of youth survey respondents said they felt safe, found the activities fun and worth their time, would recommend SSS to a friend, and wanted it continued; 96% said they would probably or definitely attend again. Young people most enjoyed learning new skills, meeting people & making connections, friendly staff & welcoming environment, fun activities, sports & games, cooking & food
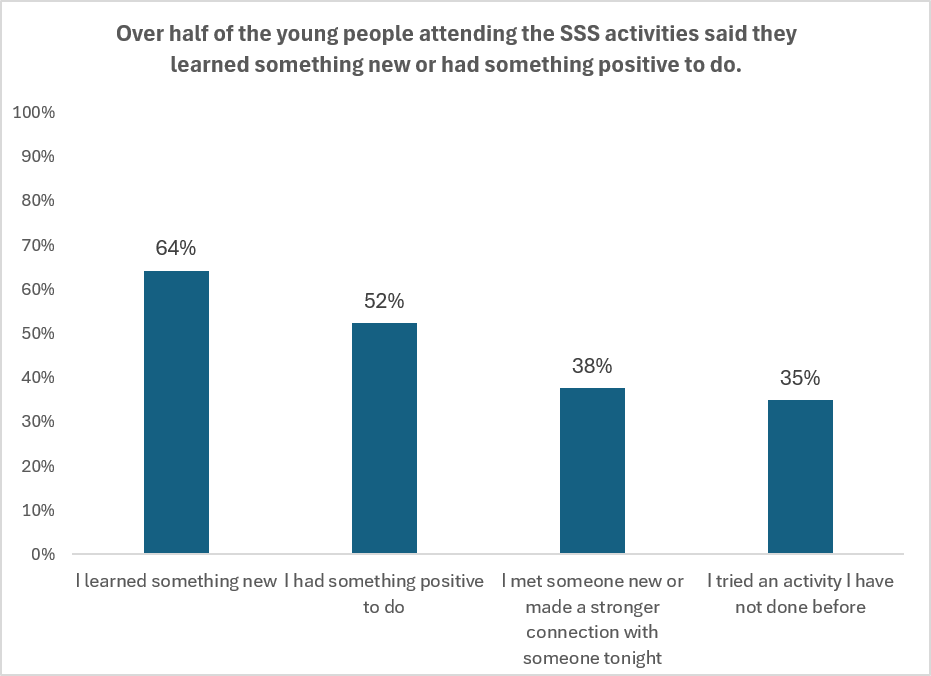
Benefits: Young people most often said they learned something new (64%) and had something positive to do (52%); about one third met someone new, built stronger connections, or tried a new activity.
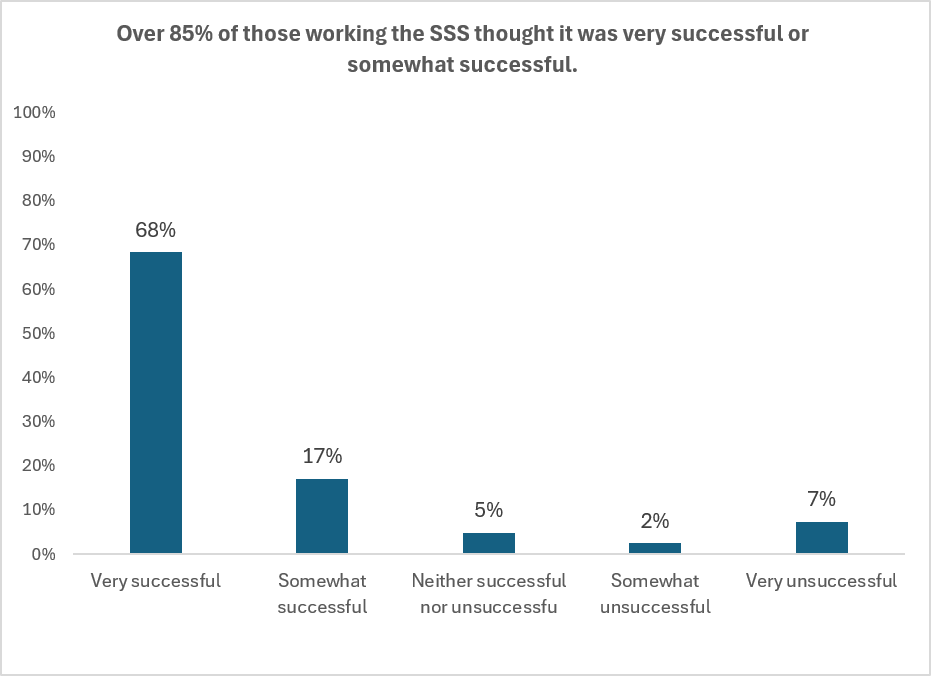
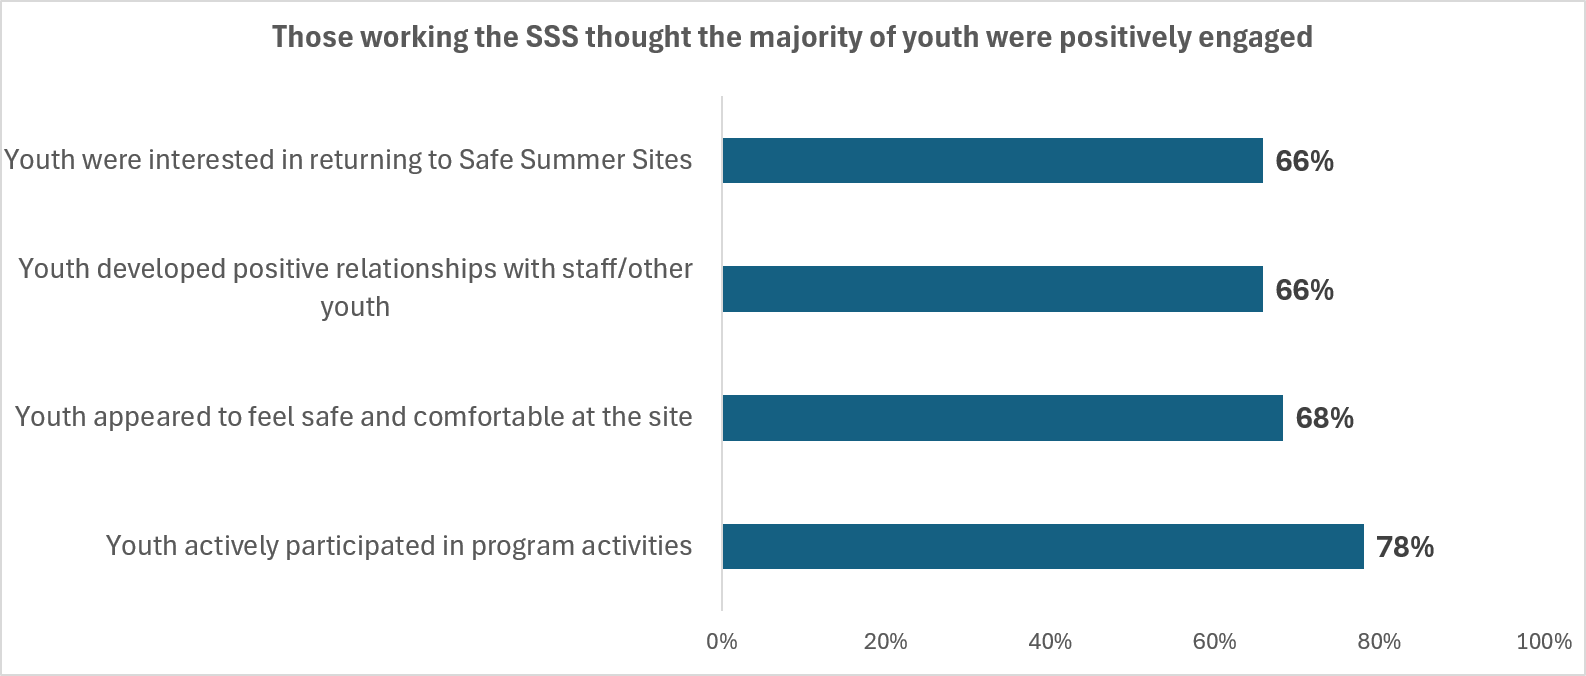
Staff and partner view: Over 85% of the 41 staff and partners responding to a follow up survey rated SSS very or somewhat successful, and at least two thirds observed youth participating actively, feeling safe, building positive relationships, and demonstrating that they would want to return. Concerns centered on heat, food, outreach, and planning.
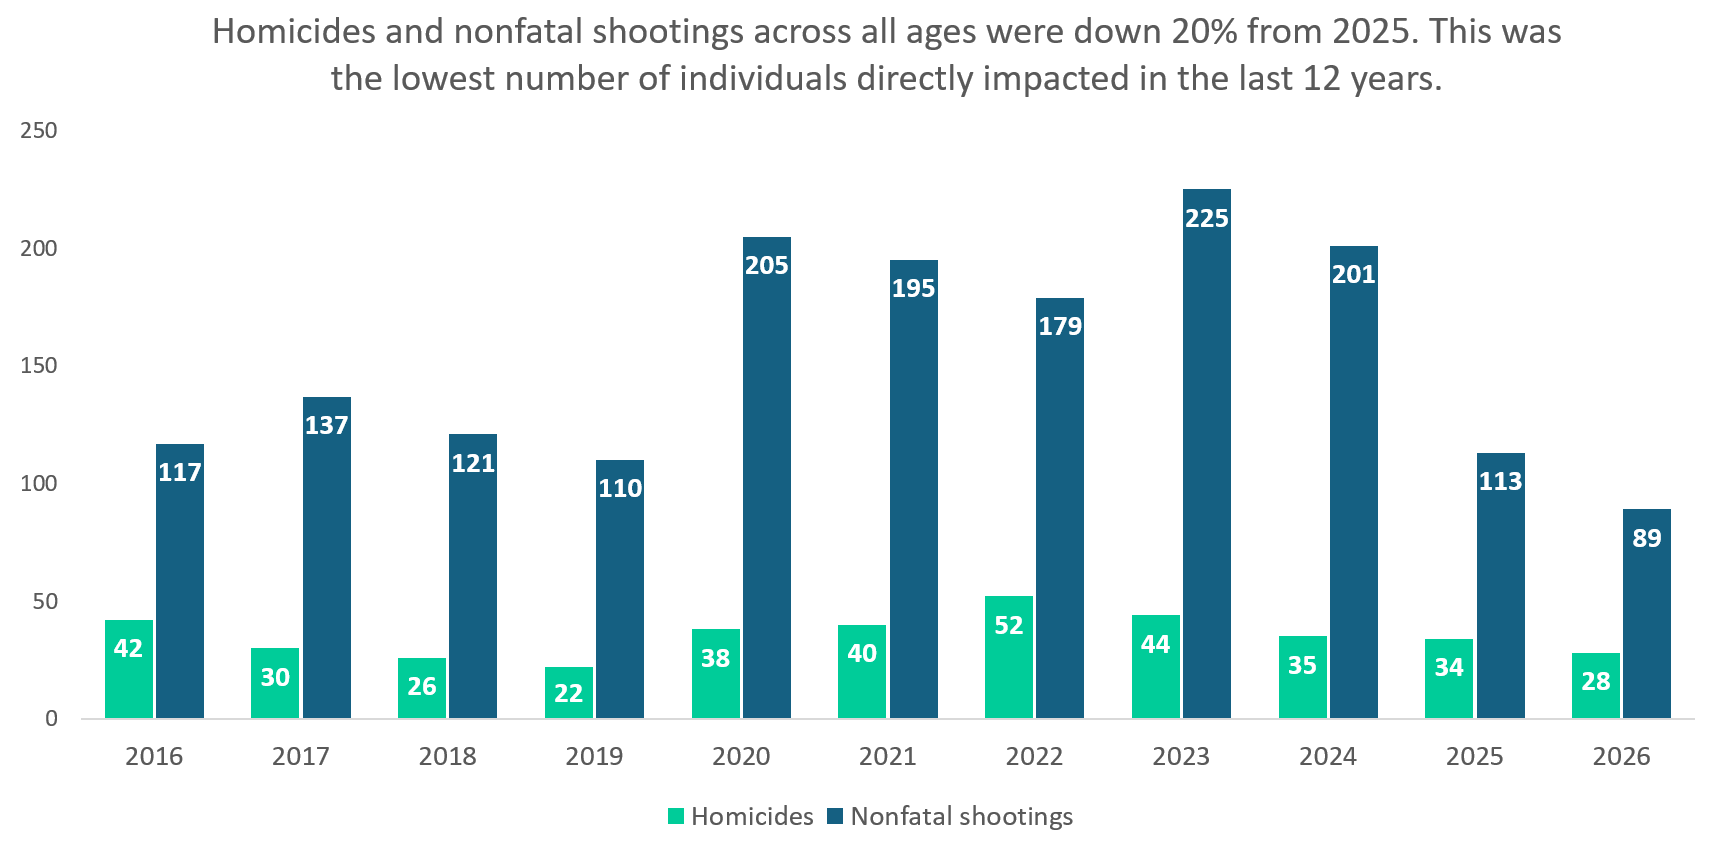
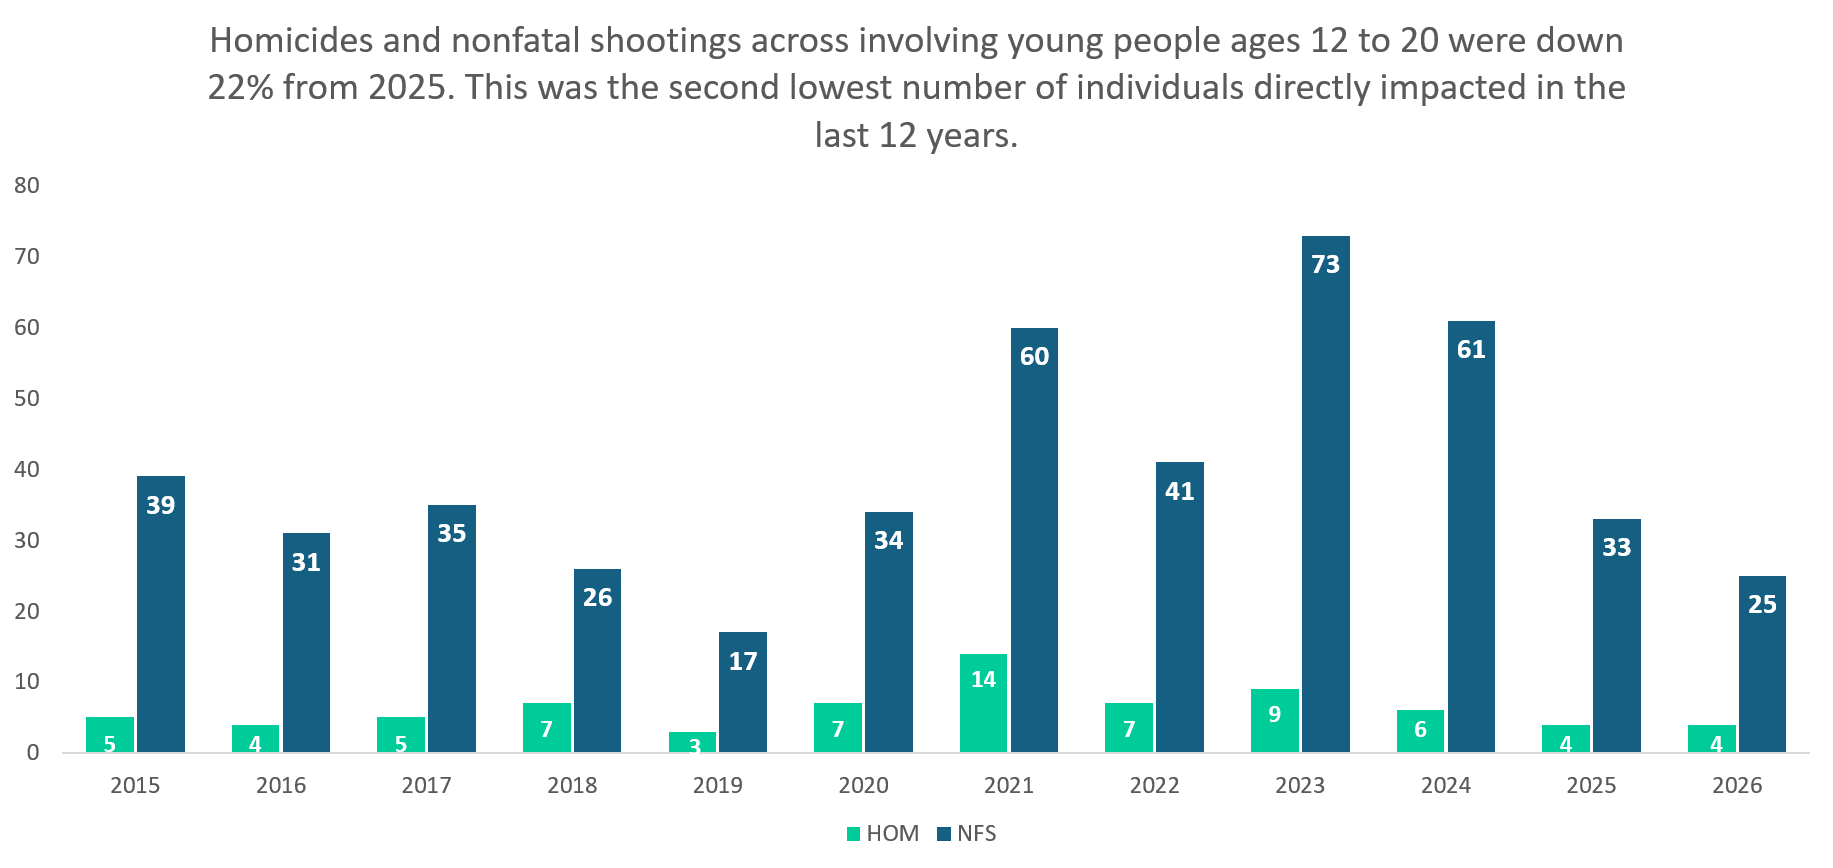
Citywide trend in violence: From June 22 to August 29, homicide and nonfatal shooting victims fell 20% from 2025 to 117, the lowest in 12 years. Victims ages 12 to 20 fell 22% to 29, the second lowest in 12 years.
Violence at and near the sites: No violence was reported at SSS locations during programming, and no incident involving youth ages 12 to 20 occurred within 400 meters of a site during operating hours. Overall counts of homicides and nonfatal shootings within 400 meters were unchanged from 2025 (7 victims each year).
When violence occurred: More than 80% of incidents involving youth ages 12 to 20 fell outside SSS hours, concentrated on weekends and in late evening and early morning hours, which points to coverage gaps for future planning
What is the Safe Summer Sites (SSS) initiative?
The main goal of SSS was to offer safe and engaging spaces over the summer for youth and young adults (ages 12 to 20), particularly during evening and weekend hours when risk of engaging in or experiencing violence tends to be higher. Designated sites offered a variety of activities so that young people had safe places to go, learn, engage, and make new connections with peers and trusted adults. The overall goal was to provide opportunities that would be of interest and benefit to young people that would help lead to a safe summer with lower levels of violence and a focus on community safety and wellbeing.
Some of the main characteristics of the SSS locations included:
Operating during summer hours when violence risk higher, evenings and weekends, when there are often fewer activities and places for young people to go.
Providing youth centered programming with a focus on enrichment, creativity, mentoring, healing, and fun.
Including the presence of trusted adults through staff, partners, and community leaders to provide engagement, structure, support, and safety and connection to other resources for additional support.
Locating the sites in priority areas based on where violence in previous summers was high and where investment over the summer has the potential to make the biggest difference.
Centering youth, young adults, and partners in the planning and implementation process.
How it came about
Summer is often a time when young people have more unstructured time and when communities such as Milwaukee experience increases in violence. SSS grew out of a shared interest in giving young people more positive and engaging options during these months, particularly during hours when the risk of engaging in or experiencing violence are higher. The initiative developed out of initial convenings Call To Action Keeping Youth Safe from Gun Violence that were held in November 2025 and March 2026, which focused on a collective approach to addressing youth gun violence. These events were convened by a number of core partners including Children’s Wisconsin, the area’s pediatric Level 1 trauma center, Milwaukee Public Schools, Greater Milwaukee Urban League, and the Milwaukee Healthcare Partnership. The events were held in collaboration with the city, the county, and a wide variety of community partners.
In addition, the effort was informed by activities that were carried out in spring 2026 including convenings with youth and young adults, as well as a survey and series of focus groups to gather direct input from young people about their experience with violence in the community (see summary graphic in Appendix A), as well as what they think is most important and needed to help young people and where they think young people would most benefit in terms of positive opportunities and support.
In combination, the direct input and ideas from young people, the data on where and when violence involving young people is concentrated, and input from partner organizations helped to inform these initial convenings. The convenings led to discussions about potential immediate steps that could be taken heading into summer 2026. The focus was on violence prevention through youth engagement and enrichment activities and activating sites during higher risk hours when fewer safe places and opportunities are available for youth and young adults and engaging in active outreach to bring young people into these spaces. The initiative built on existing community sites and relationships. Schools and community organizations across the city already served young people in a variety of capacities and SSS extended what they could offer by adding additional hours, activities, staffing, engagement, outreach, and support.
How it was supported
SSS was made possible by multiple agencies and organizations coming together with a common vision, as well as both funding and in kind support that made it possible to staff the sites and offer enhanced programming. This was a unique partnership across city and county agencies, community based organizations, schools, and others and the support came in a variety of forms ranging from organizations that provided administrative, staffing, and facilities to host the SSS, organizations that provided enrichment activities as part of the summer programming for the SSS, as well as organizations that helped to sponsor or put on events within the community during the summer months. The effort was also supported in terms of data, evaluation, and collaboration by the multi disciplinary Violence Response Public Health and Safety Team (VR PHAST).
Financial Support
Initially a total of $1.14 million in direct funding was identified to support the SSS initiative across the contributing partners to pay for specific costs related to programming, staffing, and related areas. MPS then contributed time, resources, and facilities valued at approximately $2 million bringing the combined total estimated value of available funding and resources to over $3 million. The distribution of the funds by agency is shown in Table 1.
Table 1. Direct and Shared Resource Funding for SSS
| Organization | Type of Contribution | Amount |
|---|---|---|
| Milwaukee County Department of Health & Human Services (DHHS) | Direct funding | $500,000 |
| City of Milwaukee, Community Development Block Grant (CDBG) funding | Direct funding | $500,000 |
| Children’s Wisconsin | Direct funding | $100,000 |
| Medical College of Wisconsin | Direct funding | $35,000 |
| Froedtert Hospital | Direct funding | $5,000 |
| Milwaukee Public Schools | Shared resources | $2,000,000 |
| Total in Direct Funding & Shared Resources | Combined | $3,140,000 |
| Total Direct Funding | Direct funding | $1,140,000 |
| Total Expended (as of 8/29/26) | Direct funding | $902,000 |
| Total Funding Remaining | Direct funding | $238,000 |
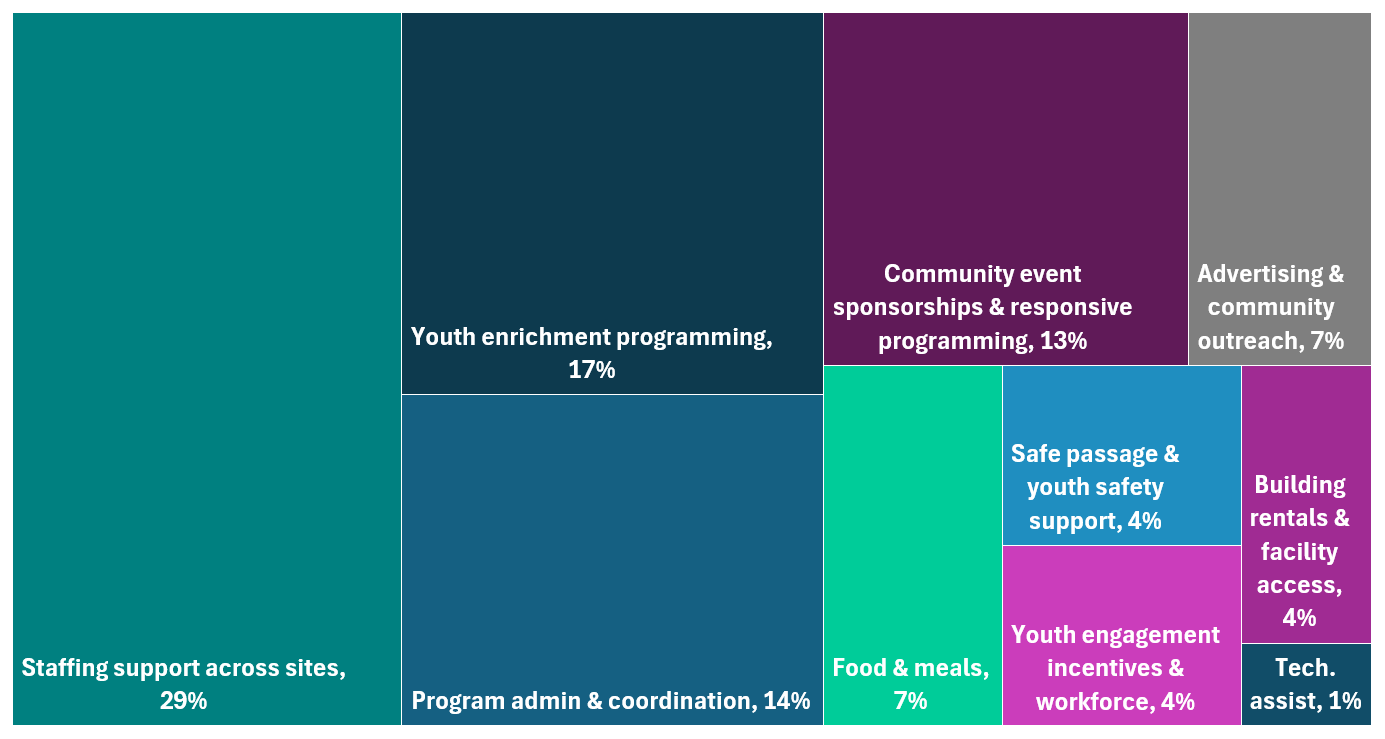
Out of the $1.14 million in direct funding, approximately $902,000 was utilized over the summer. The distribution of what the funding covered is shown in Figure 1. The largest part of the funding went to staffing support across the sites (29%) followed by youth enrichment programming (17%), program administration and coordination (14%), and community event sponsorships and programming (13%), which in combination was over $650,000 or approximately 73% of the total funding. The remaining funding of approximately $238,000 will be utilized for additional programming supporting youth and young adults beyond the summer months.
Figure 1. Direct Funding Distribution for SSS Activities and Support
Administration, staffing, or facilities
Figure 2. Organizations that support through administration, staffing, or facilities
In terms of the support around administration, staffing, and facilities, as shown in Figure 2, Safe & Sound served as the administrator for the Community Development Block Grant (CDBG), funds and the financial support provided by Children’s Wisconsin. INPOWER served as the administrator for the financial support provided by Milwaukee County Department of Health & Human Services (DHHS) and the Medical College of Wisconsin. Staffing was supported through subcontracts with multiple partners including Five Star Educational Training, INPOWER, Milwaukee Public Schools (MPS), Owen’s Place, and Boys & Girls Club. Facility expenses included rentals at Five Star Educational Training, Kosciuszko Community Center, and Dr. Martin Luther King (MLK) Community Center, along with youth memberships at the community centers. MPS was a key partner and hosted anchor sites, the main gathering places where young people could go for scheduled activities. Community organizations also served as anchor sites, including Five Star Educational Training, Kosciuszko, MLK Community Center, Boys & Girls Club, and Owen's Place.
Figure 3. Organizations that support through administration, staffing, or facilities
Employment and Youth Ambassadors
Across SSS initiative, there were existing team members from MPS and community organizations that were key to how the various activities were staffed throughout the summer (Figure 3). In addition, there were 184 individuals hired specifically for the SSS initiative to help support the full implementation. The initiative also employed 64 paid youth ambassadors, who helped develop and implement SSS activities. Early in implementation, organizers also recognized the potential risk to young people leaving anchor sites after 9:00 p.m., so a safe passage process was established to help them leave safely at the end of the evening. There were 24 team members who supported the safe passage portion of the initiative.
64 Youth Ambassadors
24 Safe Passage Team Members
184 Individuals employed
Enrichment partners
Figure 4. Enrichment Parters
Enrichment partners (Figure 4) led activities and experiences for young people and sponsored events across the city. This also included the group providing Safe Passage to help young people get to and from SSS safely. These partners provided activities ranging from basketball, boxing, and cooking to photography, music, art, mindfulness, and wellness. Additional offerings included poetry, in house programming, and open gym activities.
Community Partner Organizations
In addition to the enrichment partners that offered specific activities and engagement opportunities as part of the SSS, there were also a variety of community organizations that were part of the initiative by hosting events and activities across the city and county in addition to the main anchor sites (Table 2).
Table 2. Community Partner Organizations
| Community Partner Organizations | Community Partner Organizations | Community Partner Organizations | Community Partner Organizations |
|---|---|---|---|
| The Missing Peace Collective | Hmong American Peace Academy | First Day Fits MKE | Unity Movement |
| Mothers Against Gun Violence | Change For Syville | BIG Incorporated | The Family Reunion |
| Next Generation Leaders | Flip N Styles Barbershop | Heal The Hood | The Village Group |
| Bronzeville Fest | 414Life | Milwaukee Urban League | Your Move MKE |
| Dreams Come True Child Care | Evolve Community | Social Butterflii | |
| Sherman Phoenix Foundation, Inc. | Truth Friends | Andre Lee Ellis & Company |
What made it unique
Although there have been many previous summer initiatives in Milwaukee, there were a number of parts of this initiative that in combination made the SSS unique.
High level of engagement and commitment across organizations
There was both collaborative leadership that started the initiative, as well as partnership and commitment across a wide variety of organizations.
Short timeline from planning to implementation
Full planning did not begin until late spring 2026, after the follow up convening. Within approximately two months, funding was secured and the initiative was designed and launched. This did not come without challenges, as discussed in Challenges and Lessons Learned, but the core parts of the initiative were put together in a relatively short period of time.
Emphasis on youth and young adult input
The initiative had an intentional focus on involving youth and young adults in both the planning and implementation of the SSS. This was critical to the approach to help make sure that it would reflect what young people felt was needed and would be both interesting and valuable to young people in the community.
Data helped to guide when and where the SSS would be
Data compiled as part of the work of the VR PHAST analyst team was utilized to help guide locations and times of implementation based on where violence has been concentrated by time and location in previous summers.
Focus on measuring and evaluating the initiative
Because SSS was a new approach to summer safety, an evaluation was planned from the start. How the initiative was measured and evaluated is described in the next section.
How was the SSS initiative measured and evaluated?
The evaluation was guided by four main questions:
To what extent are youth and young adults attending and participating in SSS?
Are the youth and young adults engaged and satisfied with the programming and activities offered?
Do the SSS increase access to safe spaces for youth and young adults during high risk evening hours?
Are there changes in community safety and violence indicators overall and in the areas surrounding the participating sites?
What was measured
For each question, there were specific measures and data sources identified that fell into six categories, as shown in Table 3.
Table 3: Evaluation categories and measures for the SSS
| Categories | What was measured |
|---|---|
| Sites | How many sites there were, where they were, when they were open, and what types of activities were offered |
| Attendance | How many young people attended across locations and events |
| Who attended | Age range for youth and young adults attending and the ZIP code where they live |
| Feedback from youth and young adults | What young people thought about the initiative, areas for improvement |
| Feedback from staff and partners | What staff thought about the initiative, areas for improvement and input from partner organizations (where possible) |
| Reach | What was the reach of various efforts through websites, social media, and other platforms |
| Violence | The number of serious violent incidents (homicides, nonfatal shootings), comparison with previous years, citywide and near the sites |
How information was collected
There were multiple sources of information for the evaluation: program records, daily attendance counts, a participant survey, a staff survey, data on program reach, feedback from partners, observations from the evaluators, and violence data.
Attendance counts for the anchor locations were collected every day at each site and provided by MPS or community organizations, which were provided to INPOWER. They show how many young people attended at each location and for MPS, as well as the ZIP code where attendees lived for most of the young people. Since a significant portion of the outreach for the SSS was conducted through websites, social media, and related outlets, as well as traditional materials such as flyers that were distributed, data was also gathered and provided by INPOWER on the number of views, impressions, flyers, and overall reach. INPOWER also helped to track the hiring and staffing related to the project. These data were provided to the evaluation team for inclusion in the report.
| Role | % of Respondents |
|---|---|
| Lead program/activities | 44% |
| Site coordination | 22% |
| Mentorship | 10% |
| Security/safety | 10% |
| Partner organization/community volunteer | 2% |
| Other (clerk, event staff, youth crew/teen coordinator, etc.) | 34% |
Table 4: Roles of Staff Responding to the SSS Feedback Survey
The participant survey was a short set of questions for youth and young adults to complete through a link or QR code provided at the SSS and was meant to be made available each day the locations were open. To keep the survey short but still gather all of the data requested as part of the evaluation, it was structured for each participant to receive five questions total including the two demographic questions (age group and ZIP code) and three more questions were randomly selected from eight proposed questions (whether the activities were fun and worth their time, whether they felt safe, whether the program was valuable and should be continued, etc.). A total of 283 youth and young adults responded to the survey and the randomized questions had approximately 109 responses each. A copy of the survey is available in Appendix B.
At the end of the summer, staff and partners who worked at the SSS locations were asked to share their views on the overall initiative, programming, and participation through a separate survey. The survey was sent out through the partner organizations. It focused on what those working at the locations observed about youth participation, what they thought overall about the SSS initiative, as well as strengths and areas for improvement. A total of 41 staff and partners responded to the survey and they came from a variety of different roles including leading programming or activities (44%), site coordination (22%), and various other functions as outlined in Table 4. A copy of the survey is available in Appendix C.
The evaluation team observed various parts of the initiative as it was being developed and implemented. In addition, during check in and planning meetings, as well as larger group meetings such as VR PHAST, partners were asked for their input on what worked well and where there were challenges.
Data on violence are received and analyzed regularly as part of on going collaboration with the Milwaukee Police Department and to support VR PHAST. For this evaluation, the focus was on homicides and nonfatal shootings as key measures of serious violence and includes details such as time, location, and characteristics of the incidents and those involved to support comparisons to previous years both across the city and the areas near the SSS.
How information was analyzed
For data based on numbers, this report mostly focuses on counts, percentages, and averages, including survey questions based on categories such as ratings from 1 to 5 for strongly agree to strongly disagree. For comments, the team read the open ended responses and looked for common ideas across multiple people. Examples and quotes are included to support these themes but they are not linked to who made the comment and anything that could identify someone was removed. Program documentation and observations were used to provide specific measures of how the program was implemented, as well as context or background in particular areas. For violence, the number of homicides and nonfatal shootings this summer was compared with the same months in previous years. This included whole city and at the areas around the anchor sites with a distance of 400 meters (or approximately .25 mile).
What to keep in mind
There are a few things to keep in mind with the results. For the participant survey, it was anonymous and voluntary, so it reflects only the young people who chose to answer and may not represent everyone who attended the SSS and not all young people were given every survey question to help keep the survey short. Offering the survey daily was meant to reach as many young people as possible, but the number of responses varied by site and day and there may be multiple responses from the same person for different days they attended SSS. The survey also asked only about age range and zip code, so there is not additional information available about who attended. The survey of staff was also based on those who chose to respond and may not fully represent the views of those who worked the SSS.
Attendance counts may include the same young person more than once particularly across days, events, and locations and without individual identifiers it is not possible to tell exactly how many different people attended. These counts for some sites were also a manual process and could be subject to errors. The reach data is dependent upon the tools available to measure website and social media views, impressions, and related data. Finally, the violence data provides an important point of comparison, but the analysis conducted to date cannot indicate whether SSS caused the change. Violence rises and falls for many reasons that may be unrelated to the SSS, and one summer is a short period of time and there has not yet ben enough time to monitor the trend after the SSS concluded. The evaluation team does plan to follow the data over time and conduct additional analyses to continue to monitor and understand the short and longer term outcomes of this summer effort. Even with these limitations the information gathered gives a solid picture of how the initiative was implemented, how young people and staff experienced the SSS, and how community safety changed over the summer. When were the SSS?
The overall SSS anchor locations that focused on activities for youth and young adults were held from June 22 through August 30, 2026, in two phases (Table 5). On days when the primary anchor sites were open, they ran from 5:30 p.m.to 9:00/9:30 PM. In the first phase, from June 22 to August 6, MPS locations were open with extended hours Monday through Friday. On Saturdays, programming moved to community centers and parks. In the second phase from August 7 to August 30, programming ran Monday through Saturday at parks and community centers. This change was due to MPS locations preparing for the upcoming school year. Sundays were set aside in both phases as a day of rest and time with family rather than a programming day.
Table 5. Dates and times for primary SSS programming
| Phase | Dates | Days | Location type | Hours |
|---|---|---|---|---|
| 1 | 6/22 to 8/6 | M F | MPS | 5:30 to 9/9:30 pm |
| 1 | 6/22 to 8/6 | Sat | Community/parks | 5:30 to 9/9:30 pm |
| 1 | 6/22 to 8/6 | Sun | Day of rest/connection | No programming |
| 2 | 8/7 to 8/30 | M F | Community/parks | 5:30 to 9/9:30 pm |
| 2 | 8/7 to 8/30 | Sat | Community/parks | 5:30 to 9/9:30 pm |
| 2 | 8/7 to 8/30 | Sun | Day of rest/connection | No programming |
In addition to the regular sites, SSS included a variety of community events and pop ups. These were flexible events that could be set up in neighborhoods where needs were high, as they were identified during the summer. Examples of the events are described further below.
Where were the SSS?
| Location | Site Type |
|---|---|
| Madison High School | MPS |
| South Division High School | MPS |
| Obama School of Career and Technical Education (SCTE) | MPS |
| Washington High School | MPS |
| Pulaski High School | MPS |
| North Division High School | MPS |
| Kosciuszko Community Center | Community |
| Mary Ryan Boys & Girls Club | Community |
| Five Star Educational & Training | Community |
| Dr. Martin Luther King Jr. Community Center | Community |
| Owen's Place South | Community |
| Owen's Place North | Community |
Table 6. Anchor Sites for SSS Programming
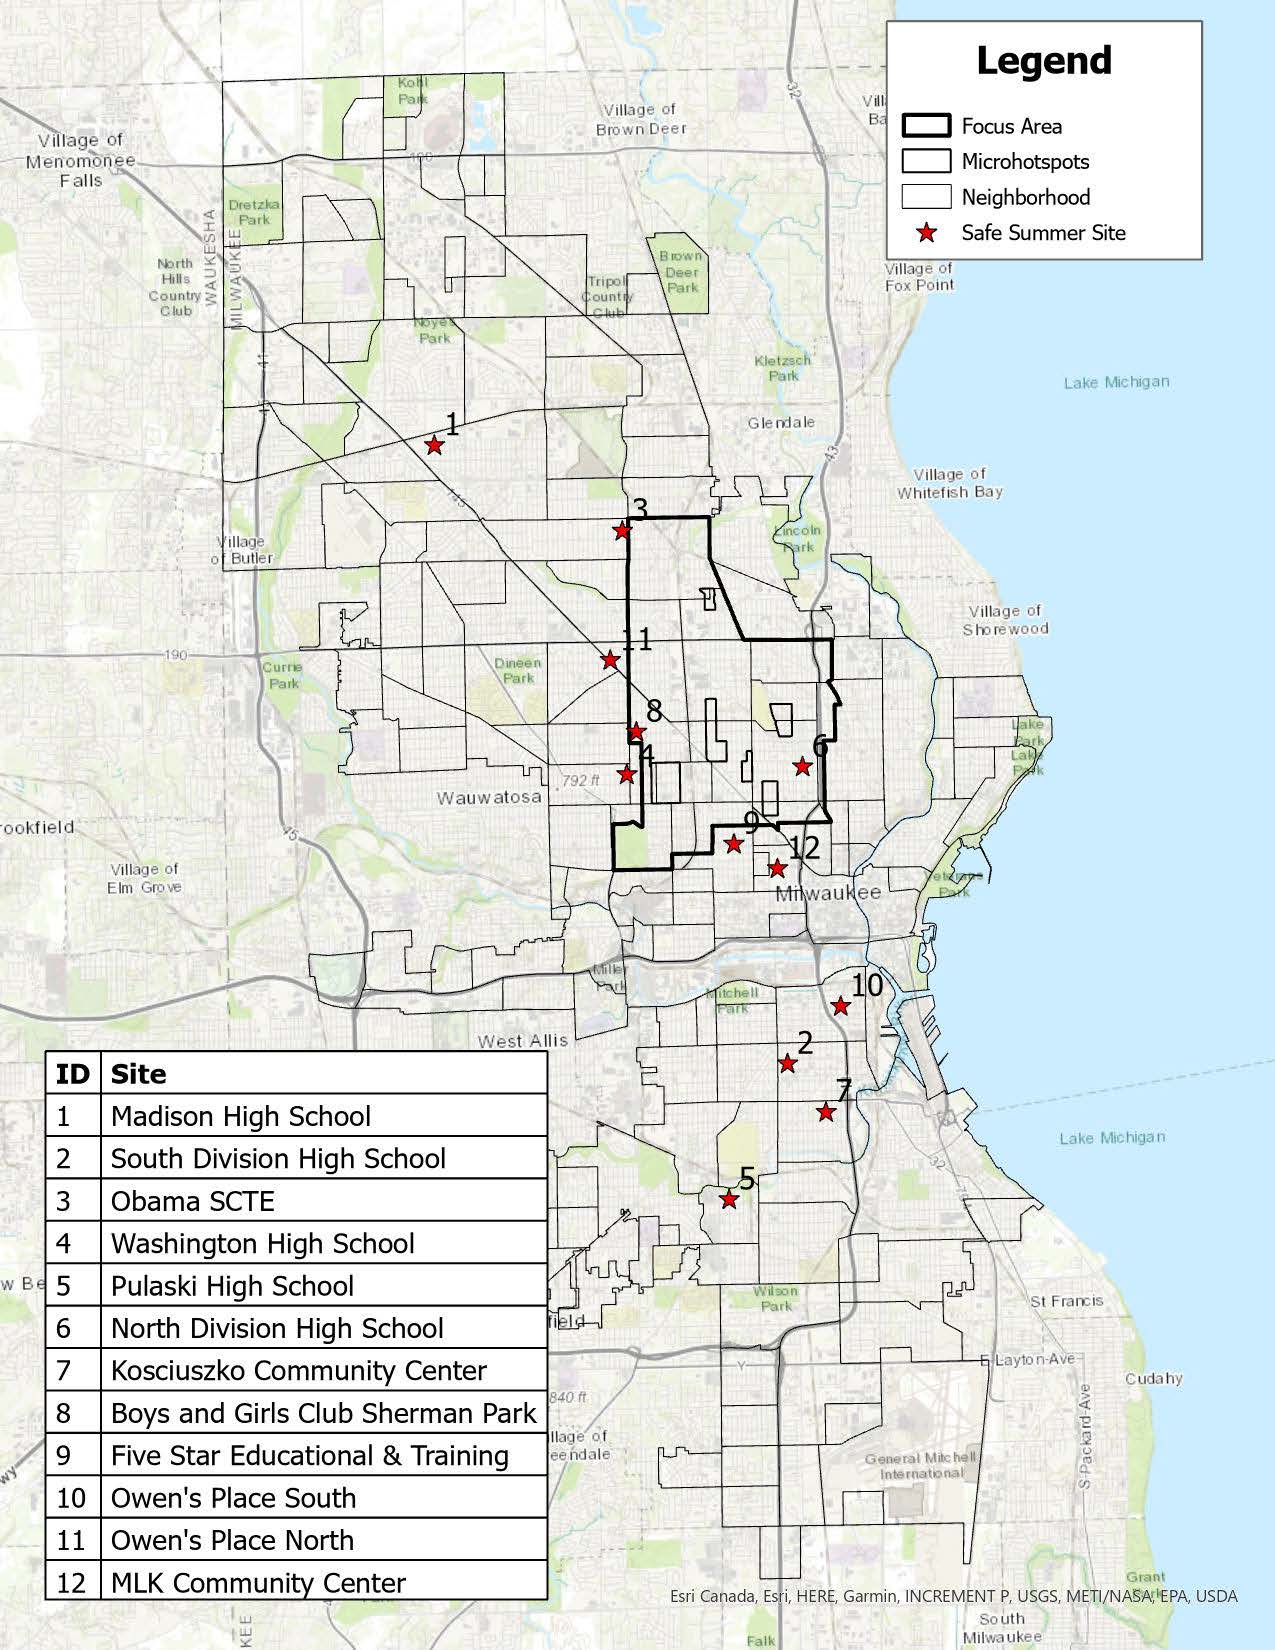
Map 1. Anchor Locations for SSS Programming
The main anchor SSS operated at 12 locations across Milwaukee during the summer of 2026, with a mix of neighborhood centers and MPS buildings, many of which were Twilight Zone locations that routinely offer some evening programming, which then were able to offer extended hours and enhanced programming for 2026. Table 6 and Map 1 show each site. Six of the sites were MPS schools and six were run by community organizations. Sites were selected based on where there were existing resources or potential locations, such as schools and community based organizations, but with an emphasis on selecting sites located in areas that experienced higher levels of violence during the summer months for previous years.
What did the outreach involve and who did it reach?
Table 7. Outreach and Engagement Tracking by Event or Source Type
There were a variety of outreach methods utilized throughout the SSS initiative to try to reach young people, their families and caregivers, and the broader community regarding the events and activities available. This included significant outreach online and through various social media outlets. Based on digital campaign tracking by IMPOWER (Table 7), there were over 7.6 million impressions (number of times the information was displayed on a screen), with a reach of over 2.7 million (number of people reached), links were clicked over 114,000 times and there were over 143,000 post engagements such as likes, comments, shares, etc. This represents a significant amount of activity across the different event or source types.
| Event or Source Type | Impressions | Reach | Link Clicks | Post Engagements |
|---|---|---|---|---|
| Enrichment Activities | 2,632,744 | 1,671,089 | 52,911 | Not Reported |
| Adaptive Events | 485,449 | 220,305 | 2,045 | 4,238 |
| Anchor Sites | 2,254,505 | 443,847 | 21,193 | 20,077 |
| Tap In Mke Website | 2,306,547 | 404,227 | 37,902 | 118,766 |
| Total | 7,679,245 | 2,739,468 | 114,051 | 143,081 |
Looking at who was receiving the information across the different event types or source types (Table 8), a somewhat higher percent of women than men and by age there was a spread across age groups that differed by event or source type. The most common age range of those reached for enrichment activities, adaptive events, and Tap In were between 25 and 44 years of age (48 to 52%). The anchor sites had a somewhat older reach with 51% age 45 or older.
Table 8. Outreach and Engagement Tracking by Event or Source Type
| Event or Source Type | % Female | Age 18 to 24 | Age 25 to 34 | Age 35 to 44 | Age 45+ |
|---|---|---|---|---|---|
| Enrichment Activities | 50% | 25% | 32% | 20% | 22% |
| Adaptive Events | 59% | 18% | 25% | 23% | 24% |
| Anchor Sites | 62% | 8% | 19% | 21% | 51% |
| Tap In | 59% | 18% | 25% | 23% | 24% |
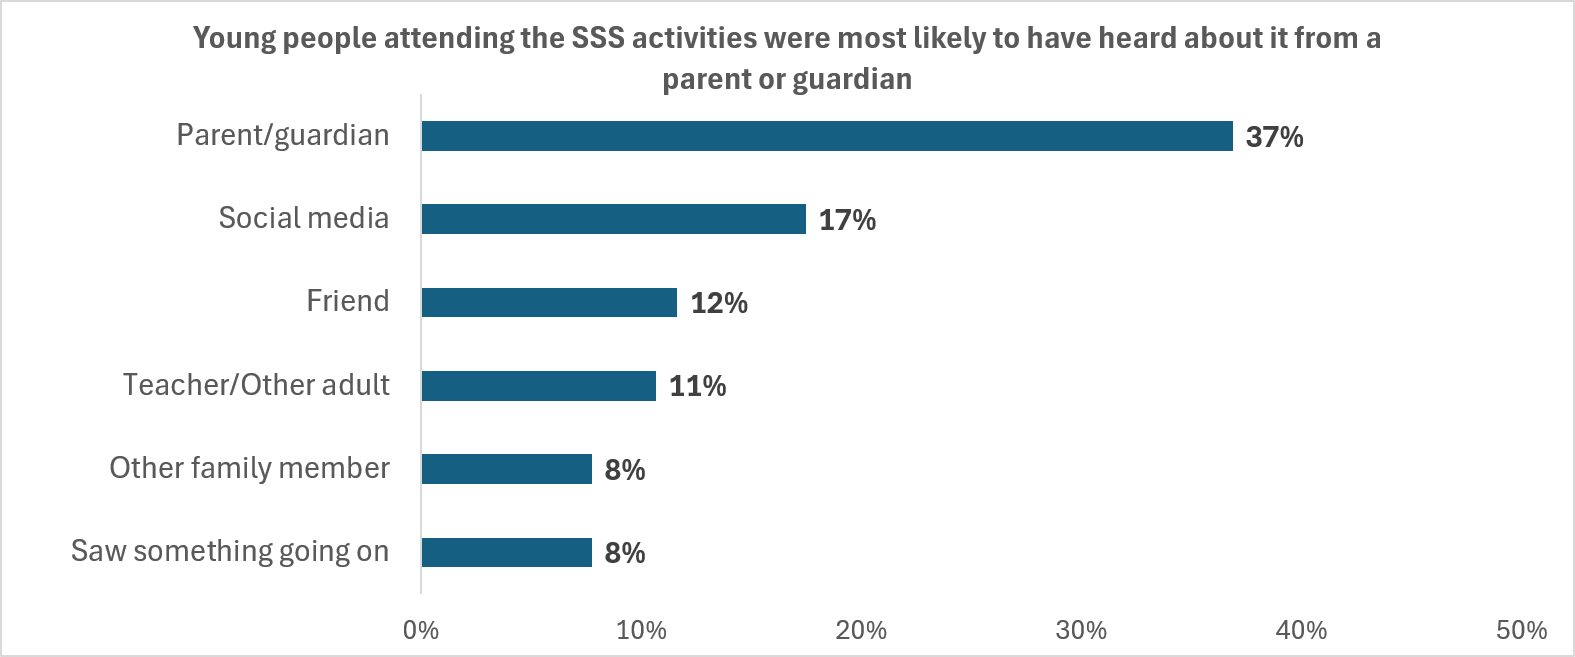
Based on the survey, the youth and young adults that attended were most likely to have learned about the SSS from a parent or guardian (37%) followed by social media (17%), a friend (12%), or a teacher/other adult (11%) as shown in Figure 5. This highlights the importance of utilizing a variety of outreach efforts to engage both young people and parents or caregivers for these types of events and activities.
Figure 5. How Young People Learned About the SSS Activities
Who attended the SSS?
| MPS Locations | Total Visits |
|---|---|
| Madison High School | 834 |
| South Division High School | 851 |
| Obama SCTE | 430 |
| Washington High School | 1021 |
| Pulaski High School | 426 |
| North Division High School | 1308 |
| Total Attendance | 4,870 |
Table 9. Youth and Young Adult Attendance by MPS Location, 6/22 to 8/6/26
For the MPS locations that served youth and young adults ages 12 to 20 during the evening hours from June 22nd through August 6th, a total of 4,870 visits were recorded during this period. Given how attendance was recorded this was based on how many young people attended each location each day and does not represent a unique count of individuals. The highest attendance was at North Division High School (1,308) followed by Washington High School (1,021), South Division High School (851), and Madison High School (834) as shown in Table 9. Based on additional information provided there were at least 1,300 unique individual young people who attended the MPS locations.
When looking at where young people lived who were attending the SSS MPS locations (Table 10), the most common ZIP Codes were 53208, 53218, 53209, 53216, and 53206 both based on the number of visits and the number of attendees. The top ZIP codes for the young people who completed the feedback survey were the same for two of the five top ZIP codes, with the highest being 53209, 53216, 53212, 53208, and 53225 (Table 11). However, when comparing the top 15 attendee ZIP codes to those who completed the feedback survey, all but one were the same indicating that overall young people attending the sites and completing the survey were generally from the same parts of Milwaukee.
Table 10. Top 15 ZIP Codes for Young People Attending MPS SSS Locations
Table 11. Top 15 ZIP Codes for Young People Completing the SSS Feedback Survey
| ZIP Code | Total Visits | Unique Attendees* | ZIP Order for Attendees* | ZIP Code | # of Responses | % of Responses | |
|---|---|---|---|---|---|---|---|
| 53208 | 853 | 297 | 3 | 53209 | 41 | 14% | |
| 53218 | 444 | 133 | 4 | 53216 | 27 | 10% | |
| 53209 | 364 | 118 | 9 | 53212 | 26 | 9% | |
| 53216 | 339 | 115 | 1 | 53208 | 23 | 8% | |
| 53206 | 301 | 106 | 10 | 53225 | 20 | 7% | |
| 53204 | 285 | 72 | 7 | 53210 | 20 | 7% | |
| 53210 | 280 | 86 | 2 | 53218 | 18 | 6% | |
| 53215 | 218 | 59 | 8 | 53215 | 17 | 6% | |
| 53212 | 169 | 57 | 5 | 53206 | 15 | 5% | |
| 53225 | 165 | 61 | 11 | 53224 | 12 | 4% | |
| 53224 | 162 | 45 | 14 | 53223 | 7 | 2% | |
| 53205 | 119 | 37 | NA | 53214 | 7 | 2% | |
| 53221 | 110 | 28 | 10 | 53222 | 6 | 2% | |
| 53223 | 88 | 29 | 12 | 53205 | 6 | 2% | |
| 53233 | 50 | 14 | 6 | 53204 | 6 | 2% |
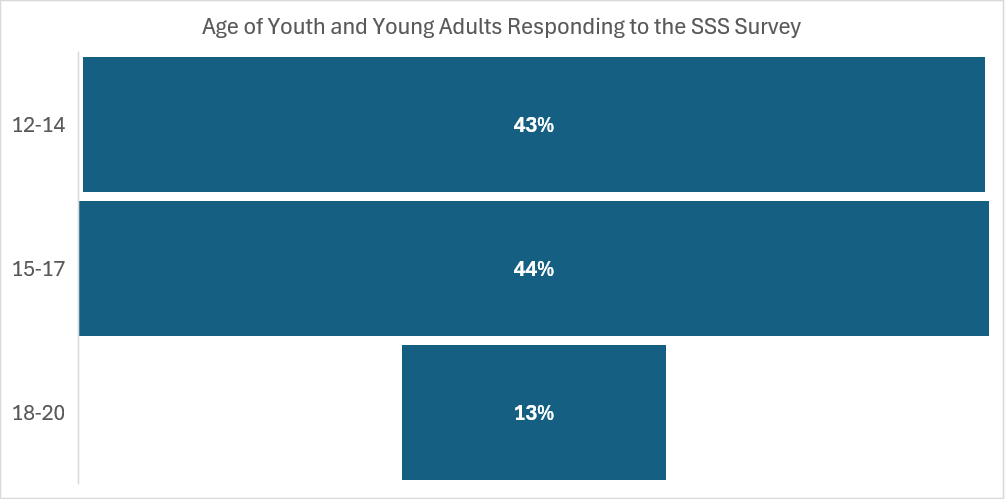
Although the age of all attendees at the MPS sites was not available, those responding to the survey did provide their age range. As shown in Figure 6, attendees were mostly between the ages of 12 and 17 (87%) with a split between those age 12 to 14 and those age 15 to 17.
Figure 6. Age of Youth and Young Adults Responding to the SSS Survey
Figure 7. Whether Young People Responding to the SSS Survey Were Attending for the First Time and Would Attend Again
Well over half of the youth and young adults responding to the survey were attending for the first time (65%) and most of the young people said they would probably or definitely attend again (96%) as shown in Figure 7.
The attendance for the local community anchor sites indicated that there were approximately 1,766 young people who attended the various activities at these locations throughout the full summer period from June 22 to August 30 (Table 12).
Table 12. Youth and Young Adult Attendance at Community Anchor Sites, 6/22 to 8/30/26
| Community Site | Unique Attendees |
|---|---|
| Five Star Education & Training | 489 |
| Dr. MLK Jr. Community Center | 377 |
| Kosciuszko Community Center | 419 |
| Boys & Girls Club | 288 |
| Owen's Place (North and South) | 193 |
| Total Unique Attendees | 1,766 |
It is also important to note that as part of the engagement with youth and young adults, there were also more broad community events. These had broader reach and often included families and others beyond the youth and young adults. Some of the top attended events and estimated attendance are listed in Table 13, based on data collected and provided by IMPOWER.
Table 13. Top Attended Community Events with Estimated Attendance
| Event | Estimated Attendance |
|---|---|
| Foam and Water Event | 800 |
| NGL Community BBQ & Spelling Bee | 550 |
| MPS Back to School Block Party | 500 |
| Heal the Hood | 500 |
| 414Life Event | 400 |
| Bronzeville Fest | 400 |
| First Day of Fits MKE | 400 |
| Evolve Community Unity Basketball | 400 |
| Hmong American Peace Academy Back to School | 300 |
| Syville | 300 |
What was offered for youth and young adult engagement?
As described earlier, partners provided activities ranging from basketball, boxing, and cooking to photography, music, art, mindfulness, and wellness. Additional offerings included poetry, in house programming, and open gym activities. When looking specifically at the attendance for various types of activities through the anchor sites there was a wide variety of offerings and this is not an exhaustive list of everything that took place. Some of the specific offerings were highlighted by the young people who responded to the survey, as described further below.
Table 14. Youth and Young Adult Attendance for Various SSS Engagement Activities
| Event | Location | Estimated Attendance |
|---|---|---|
| Teen Poetry & Self Expression Workshop | 1138 W Garfield Ave | 8 |
| Teen Lash Certification (3 Days) | 2776 N Doctor M.L.K. Jr Dr / South Division | 30 |
| Community Photoshoot with Teen Photographers | 6103 W Capitol Dr | 15 |
| Cooking with Tavi Youth Series | Barack Obama School of Career and Technical Education | 29 |
| Mad Science with Cotton Candy & Bubbles | Barack Obama School of Career and Technical Education | 24 |
| Through the Lens: Photography 101 with Pik Photography | Casimir Pulaski High School | 20 |
| Youth Intro to Boxing | Casimir Pulaski High School | 57 |
| Teen DJ Academy | Community Within the Corridor | 5 |
| Teen DJ Listening Session | Community Within the Corridor | 5 |
| Breakdance & DJ Camp | Dr. Martin Luther King Jr. Community Center | 3 |
| Cooking with Zebbra Kake | Dr. Martin Luther King Jr. Community Center | 124 |
| Dance Break with True Skool | Dr. Martin Luther King Jr. Community Center | 6 |
| Hoops & Headspace (3V3 Basketball Clinic) | Dr. Martin Luther King Jr. Community Center | 115 |
| Music x Mindfulness with Trap Therapy | Dr. Martin Luther King Jr. Community Center | 7 |
| Teen Intro to Cooking: Fireballs & Fries Edition | Dr. Martin Luther King Jr. Community Center | 35 |
| Youth Hip Hop Class With True Skool | Dr. Martin Luther King Jr. Community Center | 6 |
| Fresh Habits Free Basketball Clinic Elite Coaches | James Madison Academic Campus | 141 |
| Cooking with Tavi Teen Chef Series | Kozy Community Center | 124 |
| Paletas y Pintura Youth Paint & Sip | Kozy Community Center | 32 |
| Youth Game Night | Kozy Community Center | 38 |
| Fresh Habits Free Basketball Clinic Elite Coaches | Mary Ryan Boys & Girls Club | 89 |
| Media & Music Bootcamp / How to Become a Rapper Series | Mary Ryan Boys & Girls Club | 28 |
| Mindfulness Series with Allah Mode | Mary Ryan Boys & Girls Club | 23 |
| Cooking with Tavi Youth Series | North Division High School | 20 |
| Double Dutch Academy | North Division High School | 17 |
| Teen Intro to Cooking: Fireballs & Fries Edition | North Division High School / Washington High School | 68 |
| Comedy Kings Youth Comedy Show | Owen's Place Fond du Lac Avenue | 50 |
| Become a Shooter Photography Camp | Washington High School of Information Technology | 15 |
| Mindful Monday | Washington Park | 40 |
| Teen Poetry & Self Expression Workshop | 1138 W Garfield Ave | 8 |
What did youth and young adults think about the SSS?
The overall feedback was very positive from the youth and young adults who completed the survey after attending, with over 92% agreeing that they would recommend the program to a friend, felt safe at the SSS, thought the activities were fun and worth their time, and see the program as important for young people and should be continued (Figure 8).
Figure 8. Feedback on SSS Activities from Youth and Young Adults
When asked about their experience based on attending the SSS that evening, the most common responses were that they learned something new (64%) and had something positive to do (52%). Although fewer responses, about one third of young people said that they met someone new or made stronger connection or tried an activity they had not done before (see Figure 9).
Figure 9. What Young People Gained Because of Attending the SSS Activities
When asked to explain what they liked best about the SSS they attended, the responses grouped into a few areas. Young people said they enjoyed:
Learning new skills
Meeting people & making connections
Friendly staff & welcoming environment
Fun activities, sports & games
Cooking & food
The following represent some of the feedback in the words of the young people:
Learning how to introduce myself to people
Meeting new people and growing bonds with them, the staff are very nice and welcoming
Meeting new people and having a conversation with a woman who said my safety was her number 1 concern cause not s lot of ppl care about us and a black lady spoke to us, gve us motivation to keep going and she offered us her cookies because there wasnt any snacks. Shout out to the PEACE MKE lady!
I liked how i got to learn new things and how I got to meet new people
That i learned how to do my future job just in 3 days
The environment and everyone being welcoming, keeping kids out the street and giving them an establishment to go to where they can play and have fun with friends
When asked about how the program could be made better, responses tended to include ideas in the following areas:
Nothing already great (this was the most common response)
More days, events, and longer or more interactive sessions
More activities, sports, and events
Provide food, drinks, and music
Increase outreach and bringing in more participants
Improvements to facilities, staffing, and safety
This feedback can be important for future planning to address the areas where young people thought the initiative could have been made better.
The following represent some of the feedback in the words of the young people:
More advertisement since this is my first time hearing about it!
…if you want some advice, I’ll say go to a local park and you’ll find kids who are likely interested to box.
I think you could make them more engaging and have more interactive lessons
More game in the gaming room. And everything else is perfect.
Something that could make the program better are probably days in certain events should be longer!
Maybe getting more kids to come so there’s more people to interact with
It was amazing but if you guys just give more opportunities and more activities it would be great!
Try and pay better attention to bullying.
Young people who attended said that if they were not at the SSS, they would have most likely been staying at home, hanging out with friends, or playing sports or another activity (Figure 10). For many of those attending the SSS provided an alternative source of activities and engagement.
Figure 10. What Young People Would Have Been Doing If Not Attending the SSS Activities
What did those who worked the locations think about the SSS?
Based on the survey from those who worked at the SSS locations, over 85% thought the initiative was very successful or somewhat successful (Figure 11) so the feedback overall was positive. There were some workers who felt that the initiative was only somewhat successful or very unsuccessful and some of their comments came through in the feedback section below.
Figure 11. Feedback on SSS Initiative from Those Working the Sites
When asked what they observed about the young people participating in the SSS activities, there was a high amount of consistency. At least two thirds of those working the SSS thought youth were interested in returning, developed positive relationships with staff or other youth, appeared to feel safe and comfortable, and actively participated in program activities, which was the most common observation across those working the sites (see Figure 12).
Figure 12. What SSS Workers Observed About the Young People Participating
When those working the SSS were asked what they saw as the strengths of the program, they tended to focus on:
Providing a safe space for youth
Engaging activities, enriching activities and youth participation
Positive relationships, engagement, and youth behavior
Overall operations and safety
The following represent some of the feedback in the words of those working the SSS:
Youth participants engaging in positive interactions with peers and staff as a whole, forging positive relationships while enjoying themselves as well as many returning on a daily/weekly basis. Multiple programs existing cohesively.
I would say that the youth really enjoyed the activities. I was able to witness a variety of events and activities through the two sites I worked at.
The youth were well behaved overall and were able to have positive interactions
kids/teens having a safe space to be kids without life's interruptions
Giving the kids a safe place to be during critical hours of the day.
When those working the SSS were asked what they saw as the areas for improvement, they tended to focus on:
Nothing already great
Improvements to facilities and operations (e.g. heat/air conditioning, food and drinks)
Enhancing outreach and communication and improve participation
More or different activities and hours
Changes to staffing, organization and planning including ensuring accurate information
The following comments are in the words of those working the SSS. Some are general suggestions, and others describe concerns from staff who viewed the initiative less favorably. They offer useful guidance for future planning.
Something that could be improved based on my experience is making sure that all events are promoted properly and the community is receiving the correct information. A few times people would come and were misinformed, but we directed the to the correct information.
Somehow increase participation more incentives? promotion during school??? also the site was really hot!
staff is unorganized alot of playing around between teen staff and kids and no 1on 1 training with staff
I believe we need more options of activities directed toward female youth. As well as differ sports for students to try. I also think we need to have some outside time during the hours when it still light outside.
Upfront knowledge of how any potential programming additional and outside entity program parameters and details that might conflict with the standard programming with real time communication.
Everything. The dates and times are not ideal, and the programming for the whole "Safe Summer Sites" was unsuccessful. I would not recommend this again.
Partner organizations should have been established or contracted sooner
What were the violence trends during the time period of the SSS?
The data around violence was tracked in number of different ways. At the SSS locations, there were no reported incidents of violence that took place while activities were underway.
Looking broader across Milwaukee during the time when the SSS were running from June 22nd through August 29th, there was a decrease in the number of individuals harmed by incidents of serious violence, specifically homicides and nonfatal shootings. The number of individuals directly impacted dropped 20% compared to the same time in 2025. There were a total of 117 total victims recorded as shown in Figure 13. Overall, this was the lowest recorded number of victims during this time period in the last 12 years.
Figure 13. Homicides and Nonfatal Shootings in Milwaukee, 6/22 to 8/29
Looking at the same time period but for the focus age range of youth and young adults ages 12 to 20, there was a decrease of 22% from the same time in 2025. There were a total of 29 total victims ages 12 to 20 as shown in Figure 14. Overall, this was the second lowest recorded number of victims in the last 12 years, with the lowest being 2019.
Figure 14. Homicides and Nonfatal Shootings Ages 12 to 20 in Milwaukee, 6/22 to 8/29
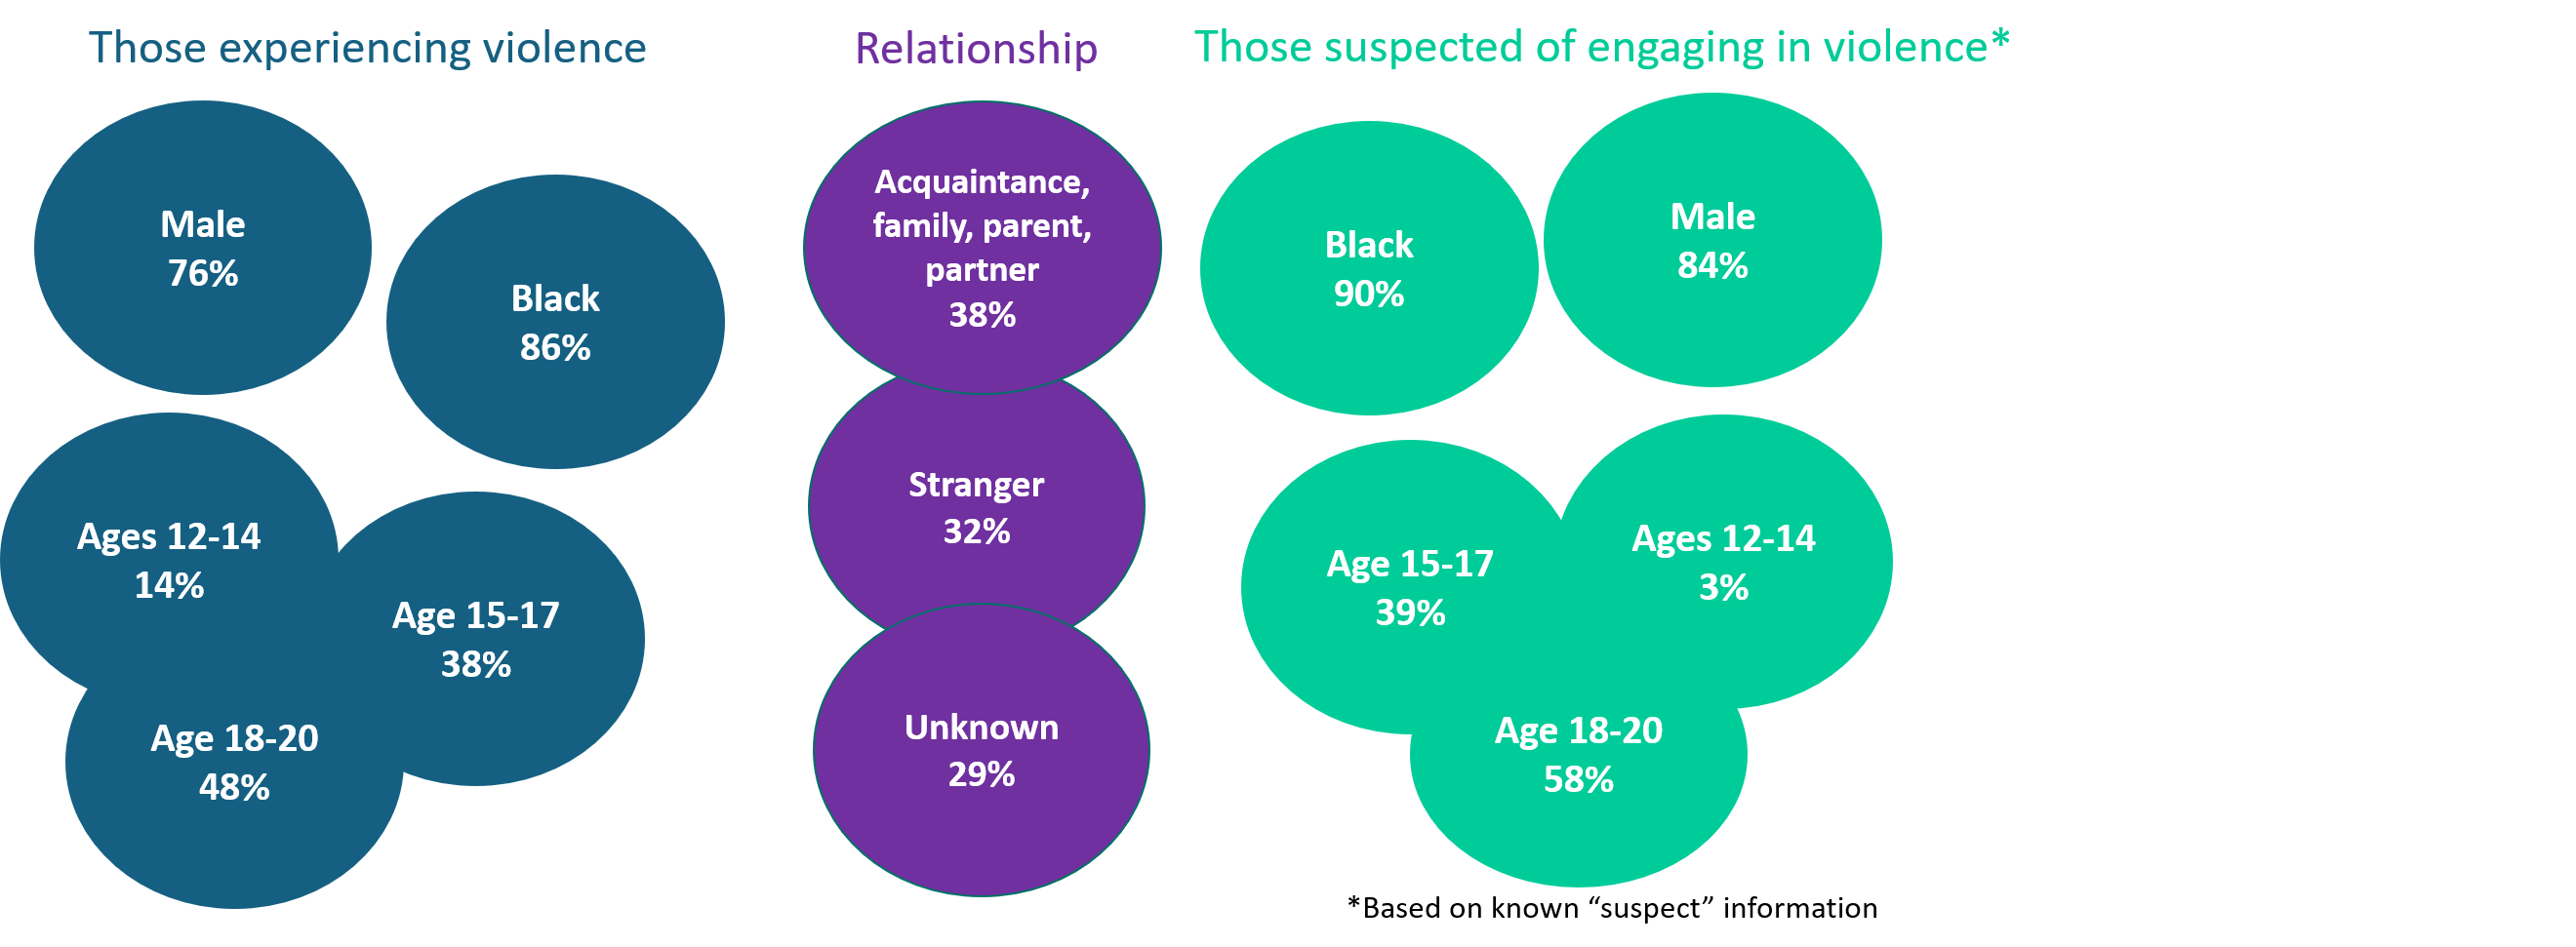
When looking at the demographics of the incidents for the incidents involving those ages 12 to 20 (Figure 15), both those experiencing violence and suspected of engaging in violence were identified as primarily male (76% and 84%) and Black (86% and 90%). Those experiencing victimization were slightly younger (52% ages 12 to 17) than those suspected of engaging in violence with (42% age 12 to 17). In terms of the relationship between those involved, of those where the relationship was known it was split between those where the individuals knew each other such as an acquaintance, family member, or partner (38%) and those thought to be strangers (32%).
Figure 15. Demographics of Homicides and Nonfatal Shootings for those Ages 12 to 20, 6/22 to 8/29/26
Of the incidents involving youth and young adults that did occur during this time period from 6/22 to 8/29/26:
Over 80% were not within the SSS hours (5:30 to 9:00/9:30 pm) so most incidents fell outside of the operating hours
Incidents were concentrated on Sat, Sun, and later evening, early morning hours
Most (72%) happened outside in a vehicle, street, alley, parking lot
Most common primary reason for the incidents was due to an argument or fight (38%) followed by retaliation (17%)
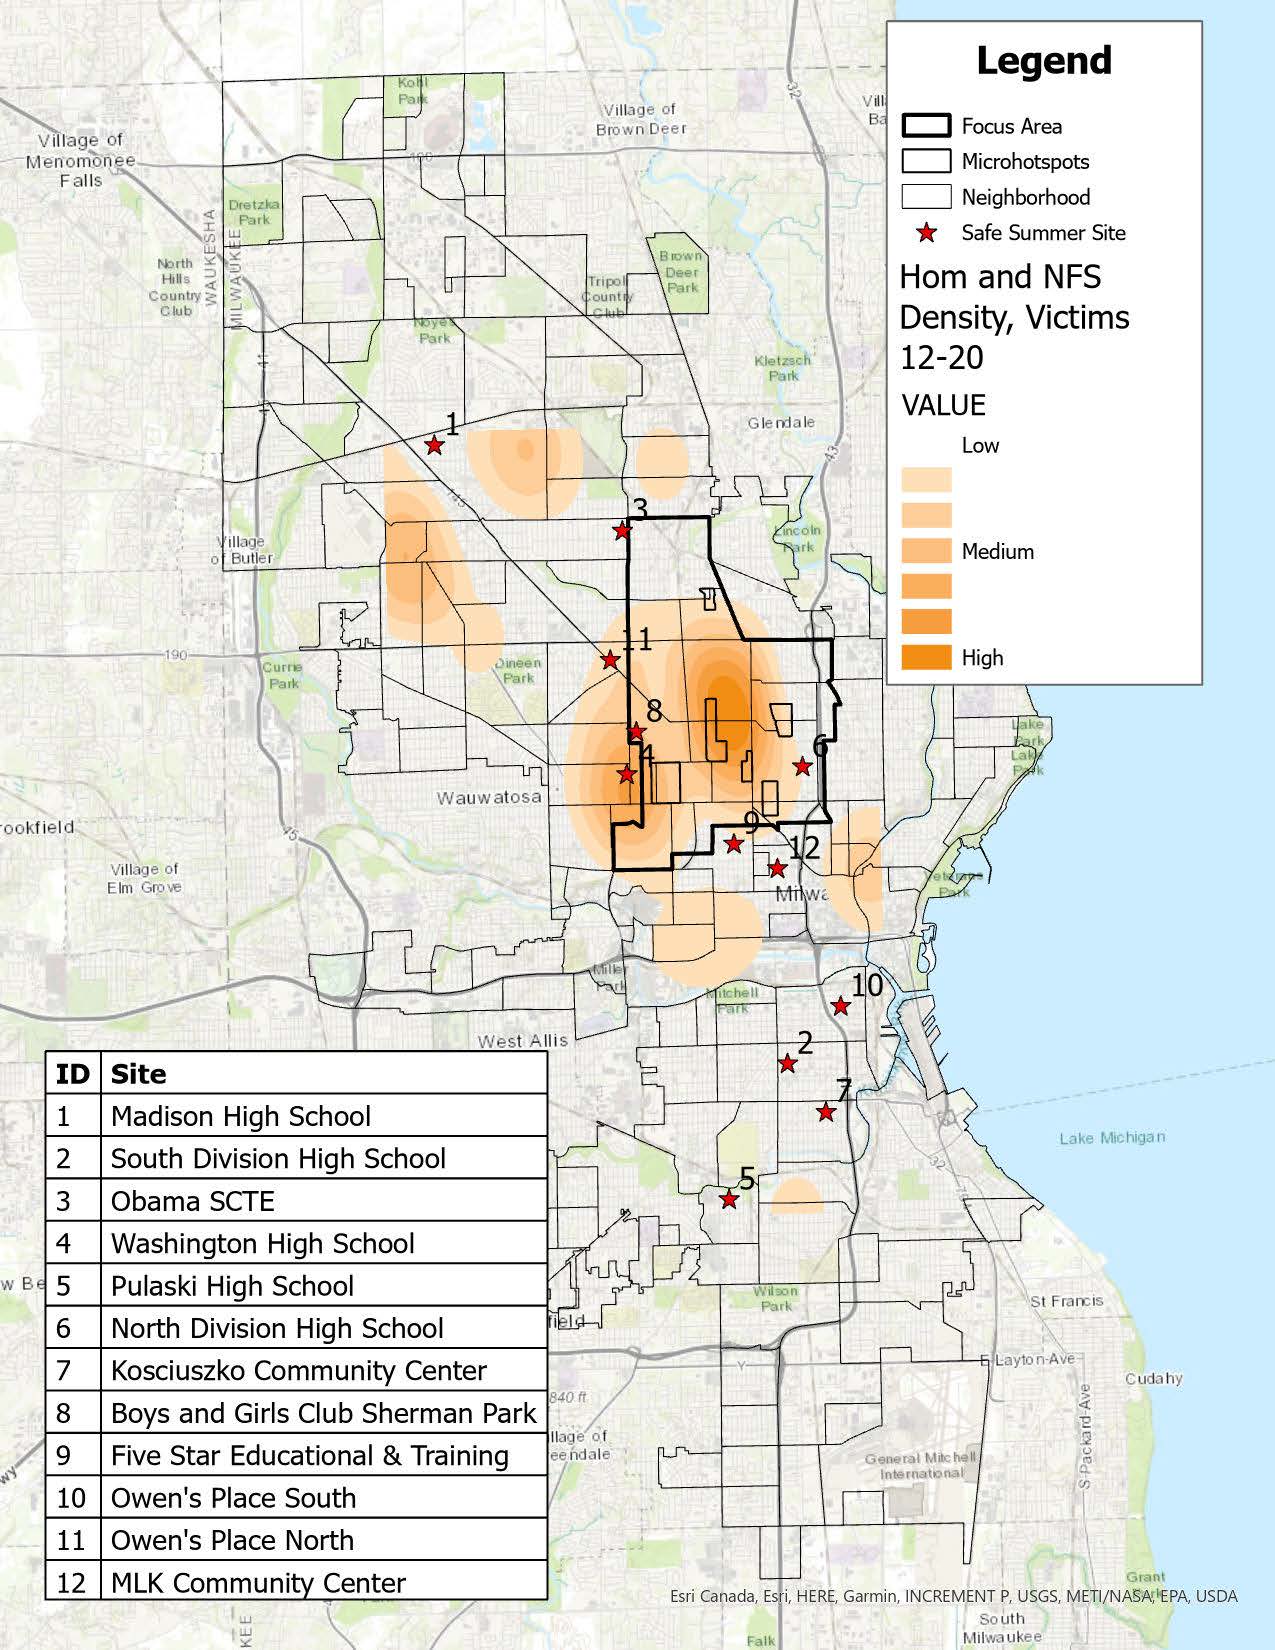
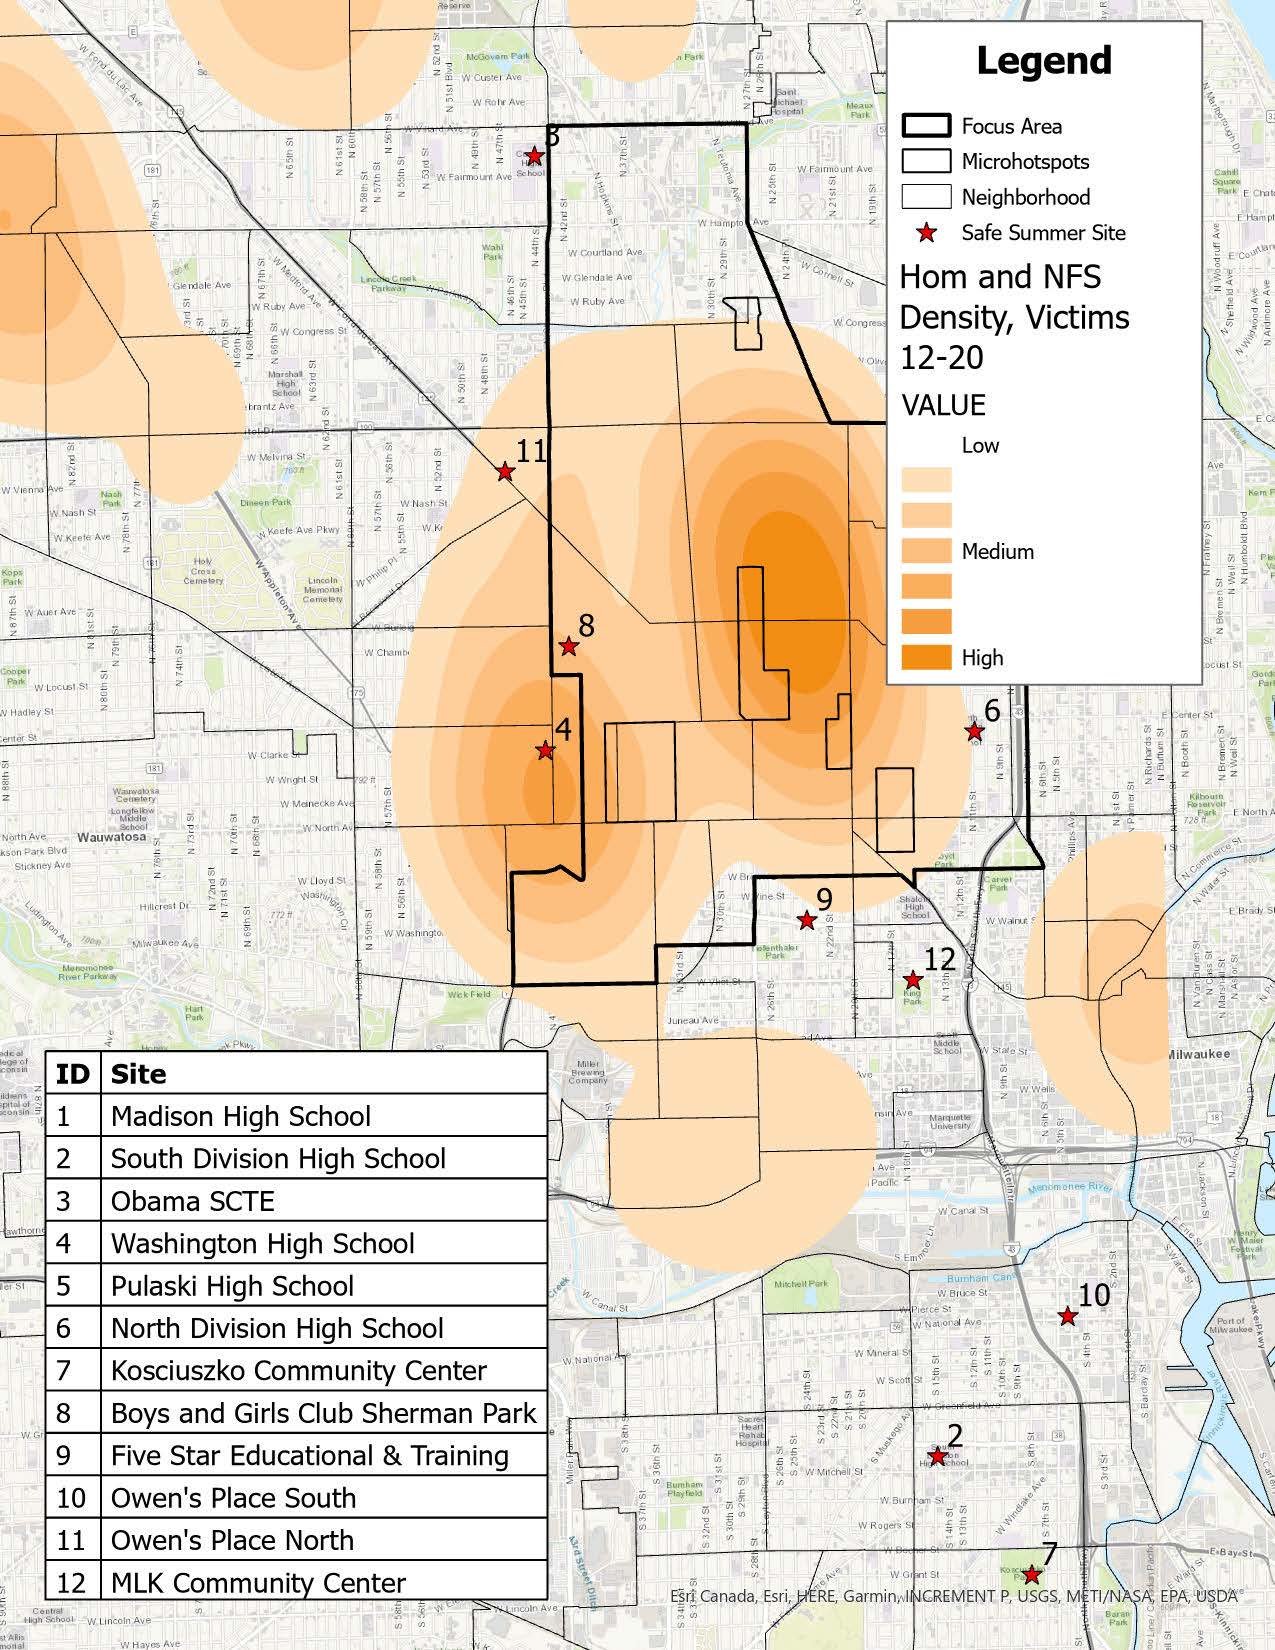
The violence that did occur involving those ages 12 to 20 was concentrated in the center part of the city in or near the VR PHAST focus area.
Maps 2 and 3. Density of Homicide and Nonfatal Shootings, Ages 12 to 20, 6/22 to 8/29/26
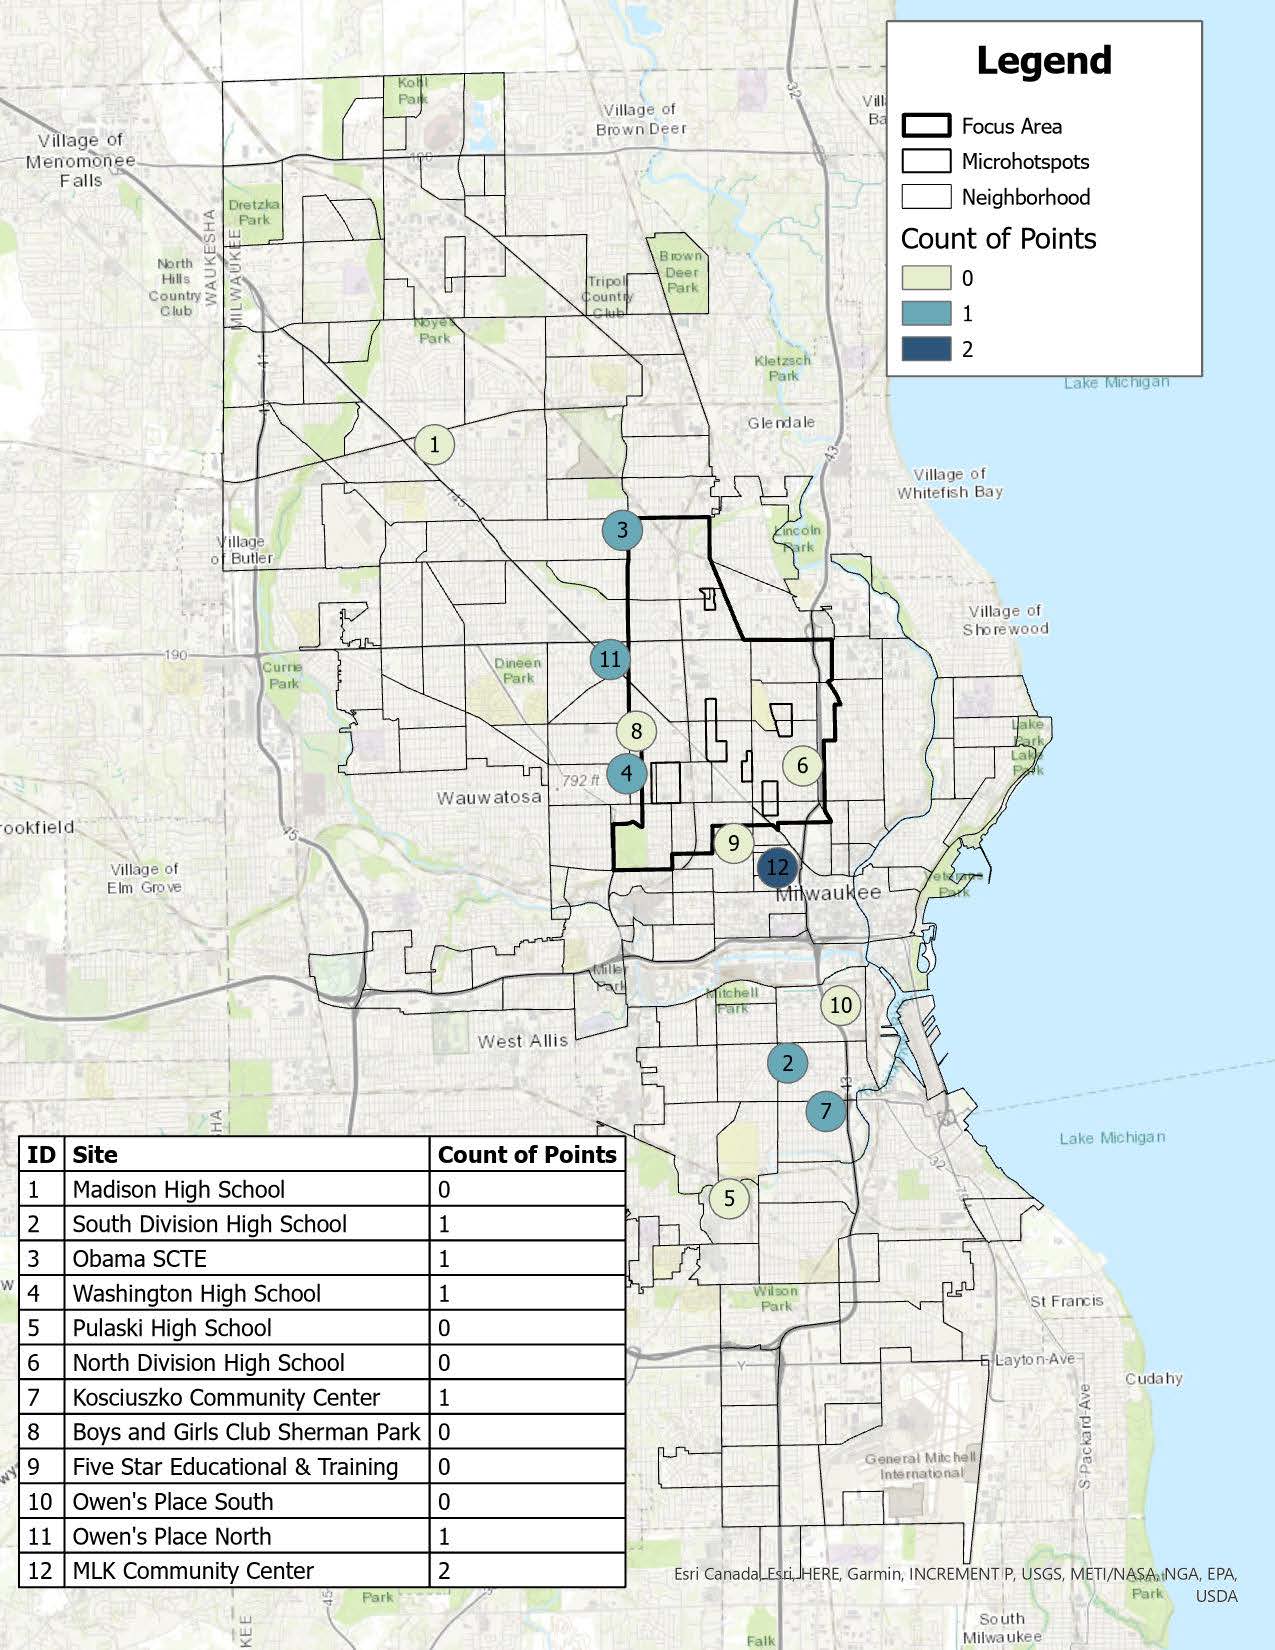
Looking more specifically at where incidents took place relative to the SSS locations, out of the total number of homicides and nonfatal shootings during the SSS time period, regardless of age, there were 7 victims of homicide and nonfatal shootings within 400 meters (.25 miles) of SSS anchor locations in 2026 and 2025 so there was essentially no difference between the two years, although the locations did shift between the two years.
Maps 4 and 5. Location of Homicides and Nonfatal Shootings, 6/22 to 8/29 to 2026 (left) and 2025 (right)
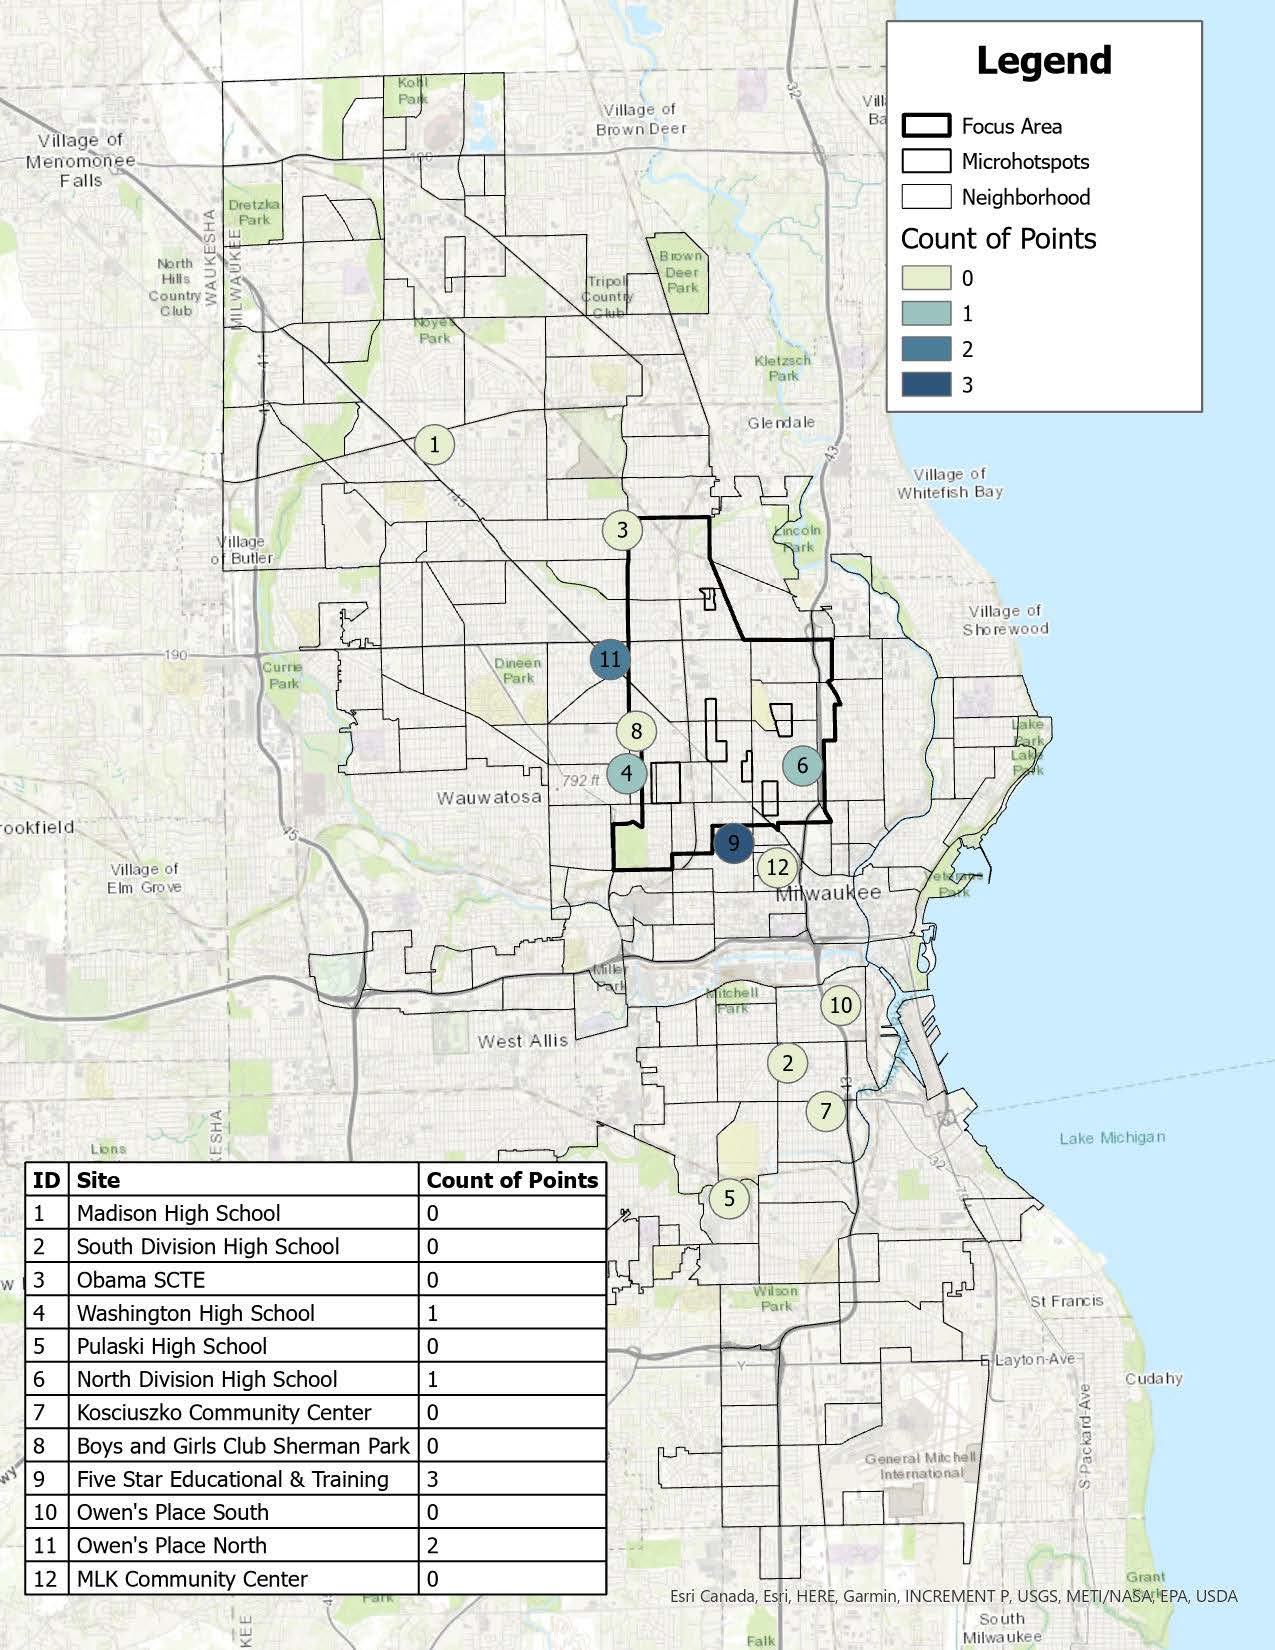
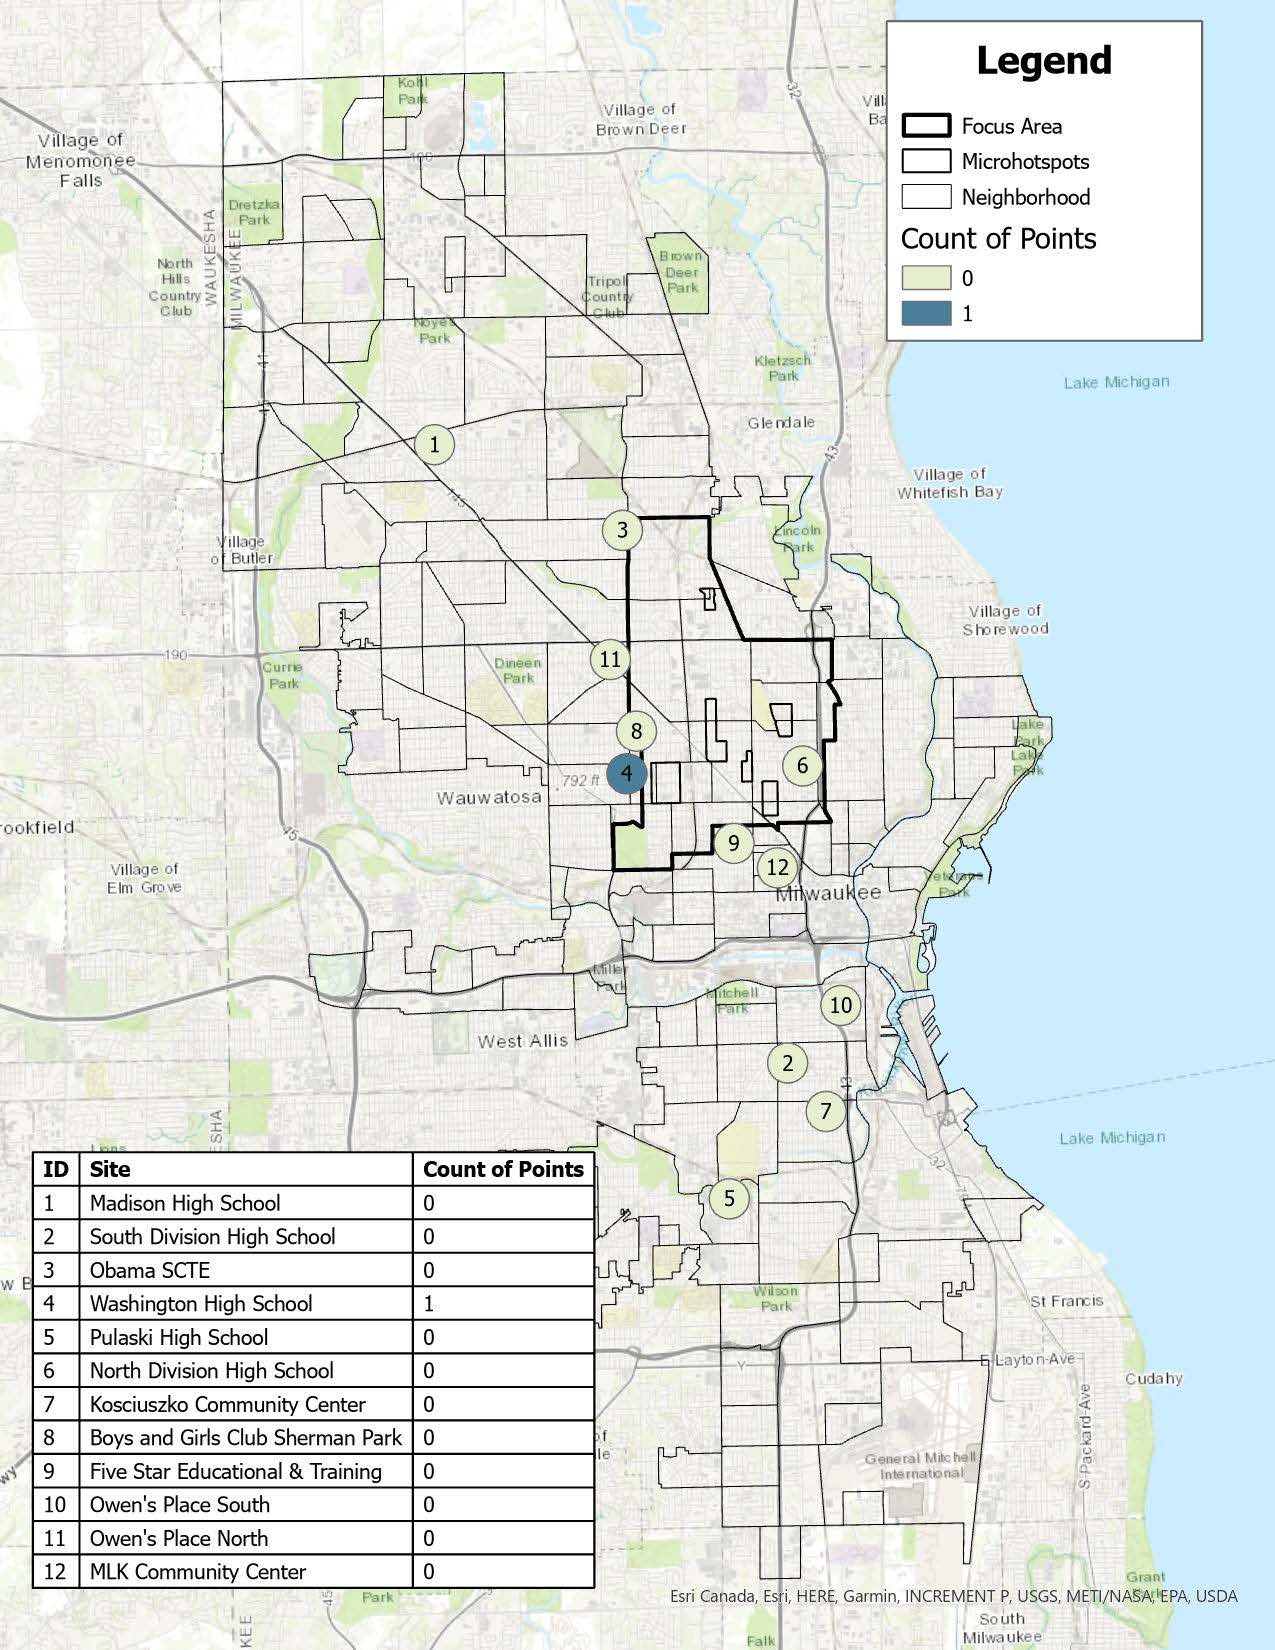
When this is narrowed to just those incidents involving youth or young adults ages 12 to 20, there was only one incident that was recorded with 400 meters of a SSS location, specifically Washington High School, but this incident occurred outside of the SSS hours. So there were no incidents of violence involving youth ages 12 to 20 recorded within 400 meters of the SSS locations while the anchor sites were operating this summer.
Map 6. Location of Homicides and Nonfatal Shootings, Ages 12 to 20, 6/22 to 8/29/26
Challenges and lessons learned
Based on a combination of all of the data sources and feedback from the partner organizations, there were a number of challenges and lessons learned through this initiative.
More planning and coordination time:
This initiative was put together in a very short time period and having more lead time would have been beneficial and should be a future goal and should help to guide the work moving forward.
At the same time, it did demonstrate that it is possible to pull an initiative together in a short time period with partners who are engaged and committed to moving the work forward.
Flexible and responsive funding is important:
Having funding that can move quickly and adjust to the planning process and community needs is important to move this type of initiative forward, particularly on a short timeframe.
For example, flexible support from Milwaukee County DHHS and Children’s Wisconsin helped get the initiative up and operational and helped to cover upfront expenses.
Other funding relied on a more structured reimbursement model, such as the CDBG funds, which impacted timing for some of the implementation efforts and is part of the fact that there is funding remaining to be spent after the initial summer period. Although there is a plan being developed to put these funds toward continuing engagement activities beyond summer, the process did lead to administrative and timing challenges and some of the activities were not able to start as soon as anticipated schedule and some sites started later than the planned June 22 date.
Reimbursement timelines also require organizations to carry costs for a period of time prior to reimbursement which can be challenging for partners and can limit how quickly organizations can act and respond. For example, smaller organizations may have the relationships, programming, and services needed to reach young people but may lack the reserves to cover upfront expenses.
For future efforts, there may be more up front discussion and clarification needed about spending requirements, guidelines and restrictions, and documentation required for various funding sources, with a focus on having a more flexible spending plan that can be responsive, such as having advance payments or unrestricted funds, but with clear expectations. This can potentially help to balance the ability to be flexible, timely, and responsive, while at the same time focusing on accountability and transparency.
Involving young people directly, and those who work with young people, is critical:
This effort had an intentional focus on involving youth and young adults throughout the process. This included having young people involved in portions of the planning, the launch, and the implementation.
There was also a focus on having agencies and organizations that work with young people involved in various capacities throughout the development and implementation.
At the same time, with the compressed timeline of the planning and implementation, there is still opportunity to improve this process in the future by engaging a wider range of young people and organizations earlier in the process.
It was also difficult to assess, outside of the age and zip code information, whether the SSS was reaching young people at risk of involvement in gun violence. This is an area for potential enhancement with both outreach and evaluation going forward.
In addition, the anonymous feedback received from the survey, as well as specific feedback from partners, can provide ideas on both what was well received, as well as areas where there are opportunities for improvement. This feedback should be used to inform future initiatives attempting to engage youth and young adults, including those at risk of experiencing and/or engaging in gun violence.
Where do we go from here?
Based on the evaluation results and feedback from partners, there are a few key areas that have been outlined in terms of next steps.
Enhancing the focus and priority given to grass root support for this type of initiative
Working further with philanthropic organizations for potential future support and continued programming
Making it easier for trusted community partners to be nimble and put resources to work when and where young people need them
Continuing to center youth and young adults in the planning and implementation of initiatives that impact them
Having this initial engagement serve as a call to action for more consistent and on going collaboration
Overall, this SSS initiative was put together within a short period of time and it required significant collaboration to implement but the initial results overall show promising progress and a new approach to collaborative prevention work of this type in Milwaukee.